


- W. R. Berkley reported third quarter 2026 revenue of US$3,738.81m and net income of US$446.01m, with basic EPS from continuing operations of US$1.15.
- Across the first nine months of 2026, W. R. Berkley produced US$11,145.26m in revenue and US$1,413.48m in net income, indicating that year to date earnings provide a more comprehensive picture than the quarterly snapshot alone.
- We will now examine how W. R. Berkley's combination of quarterly and nine month earnings results may influence the investment narrative you use for evaluation.
See how W. R. Berkley's latest earnings compare with those of its peers by running the same filters across our curated list of solid balance sheet and fundamentals (24 results).
W. R. Berkley Investment Narrative Recap
To own W. R. Berkley, you need to be comfortable with an insurance group that leans heavily on underwriting discipline, specialty niches and capital return, rather than rapid top line expansion. The latest quarter showed revenue and earnings that were slightly below the prior year period, while nine month figures were ahead, so the short term story looks more mixed than broken.
The key near term swing factor is whether underwriting margins hold up as commercial pricing momentum softens and competition in property and reinsurance stays intense. The main risk is that softer rates and past pullbacks in treaty reinsurance leave less protection if loss trends or large events turn against W. R. Berkley.
The earnings release for the third quarter and first nine months of 2026 matters most here. Quarterly net income of US$446.01m and basic EPS of US$1.15 compared with higher figures a year earlier, while nine month net income of US$1,413.48m and EPS of US$3.62 remained above the prior year, so results sent a mixed but detailed signal on execution.
For you, that mix frames catalysts and risks more clearly. Insurance segment underwriting and claims outcomes now carry extra weight, because the Reinsurance & Monoline Excess retrenchment and softer commercial pricing increase the importance of maintaining combined ratios and investment income. How effectively W. R. Berkley reallocates toward better priced lines and focuses on its specialty capabilities will shape how this earnings profile evolves.
W. R. Berkley's narrative projects US$13.9b revenue and US$1.9b earnings by 2029, which sits against analyst assumptions of a 2.2% yearly revenue decline and earnings that stay flat at about US$1.9b compared with current earnings.
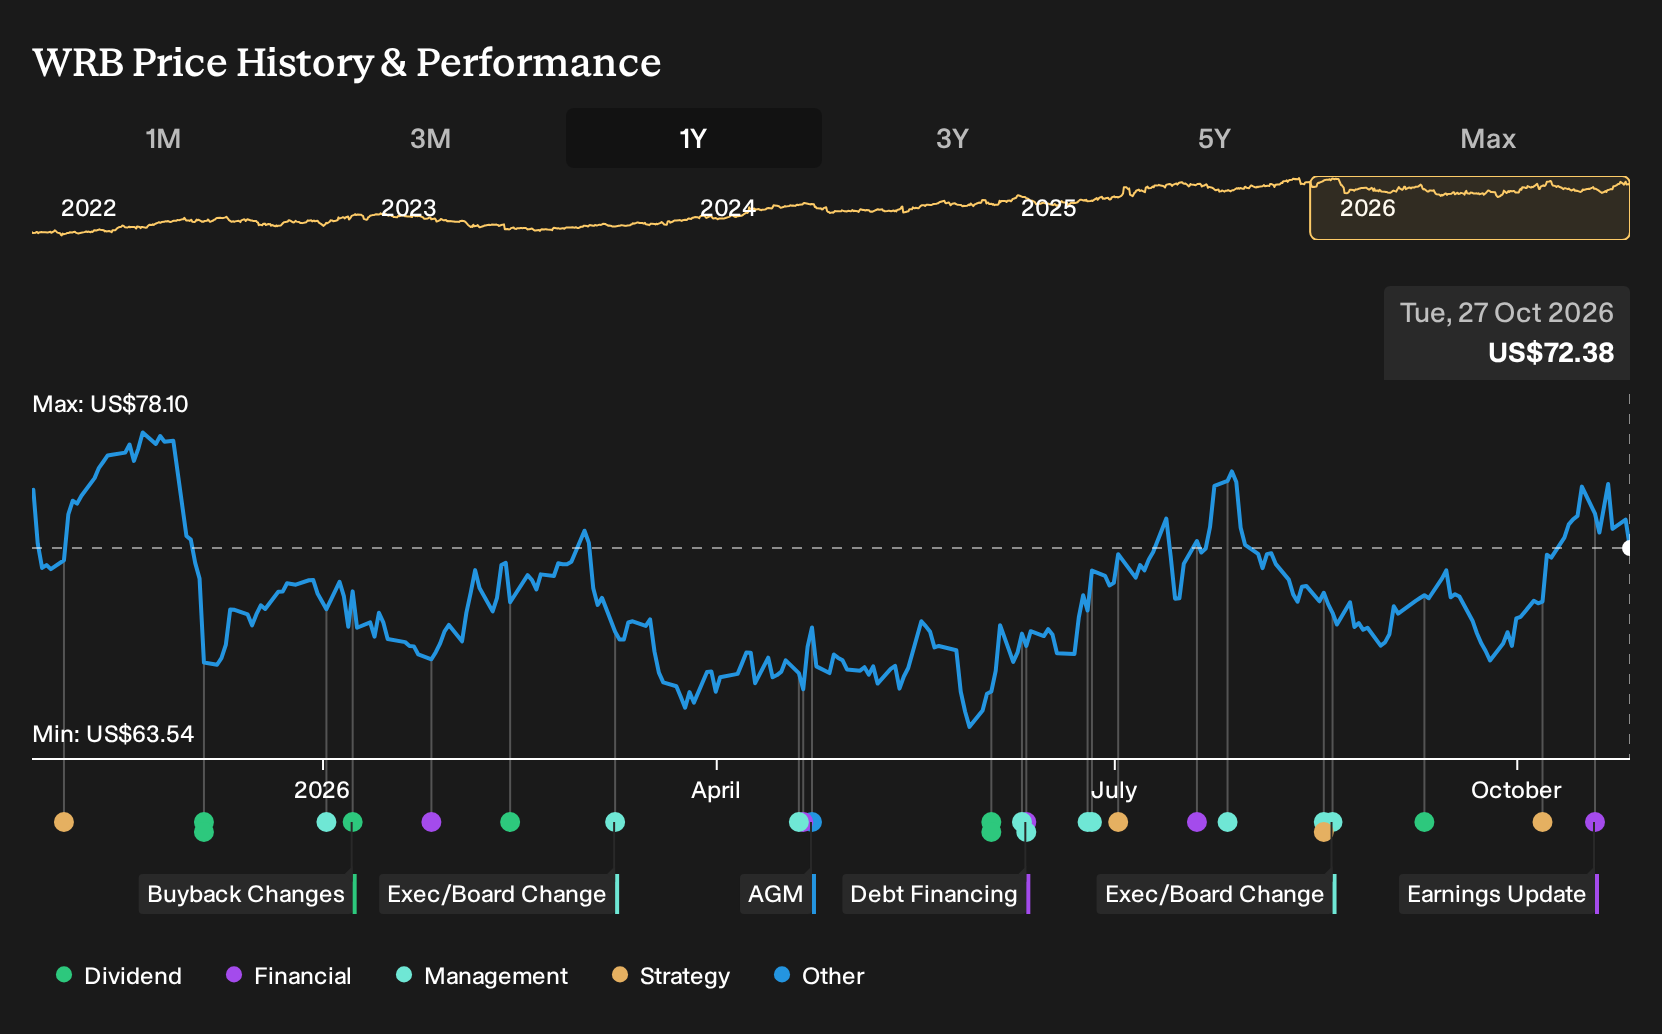
Uncover why W. R. Berkley's fair value indicates a 4% potential downside to its current price, a valuation premium that leaves little room for error.
Exploring Other Perspectives
One alternate view on W. R. Berkley leans hard on a single concern. Bears worry that moderating rate hikes and shrinking reinsurance exposure will not cover tougher competition, so future underwriting margins could lag. Before this earnings release, the lowest analysts were pencilling in roughly US$13.6b revenue and US$1.9b earnings by 2029. That is a more cautious script than the baseline, and it might shift again as this latest quarter is fully digested. Treat it as one lens and compare it with several others before you decide how the story fits your own expectations.
Explore another W. R. Berkley fair value estimate, including one that suggests it could be worth just $69.41.
Form Your Own Verdict
Disagree with existing narratives? Extraordinary investment returns rarely come from following the herd, so go with your instincts.
- A great starting point for your W. R. Berkley research is our analysis highlighting 1 key reward and 1 important warning sign that could impact your investment decision.
- See our latest analysis for W. R. Berkley. The report includes a comprehensive fundamental analysis summarized in a single visual, the Snowflake, making it easy to evaluate W. R. Berkley's overall financial health at a glance.
Looking For More Ideas Beyond W. R. Berkley?
If this W. R. Berkley review sharpened your thinking, you can use the same framework on a wider watchlist. The Simply Wall St screener lets you filter for balance sheet strength, quality, income potential, or lower risk profiles so you are not relying on a single story or sector.
- For investors who care most about resilient businesses with strong finances, start building your shortlist from our list of solid balance sheet and fundamentals (24 results).
- If you like the idea of paying less for quality, sort through companies that combine fundamentals with a discount using the 29 high quality undervalued stocks.
- Income focused readers who want yield with substance can scan for stronger cash payers with the 5 dividend fortresses.
Have feedback on this article? Concerned about the content? Get in touch with us directly. Alternatively, email editorial-team@simplywallst.com