



Climate control solutions provider Lennox International (NYSE:LII) met Wall Street’s revenue expectations in Q3 2026, with revenue rising 10.2% year on year to $1.57 billion. However, it's non-GAAP profit of $6.84 per share was 7% below analysts’ consensus estimates.
For more on Lennox, read our free full research report.
Lennox (LII) Q3 2026 highlights:
- Revenue $1.57 billion vs S&P analysts’ consensus estimates of $1.58 billion (10.2% year-on-year growth, in line)
- Adjusted EPS $6.84 vs S&P analysts’ consensus estimates of $7.36 (7% miss)
- Adjusted EPS guidance $21.25 at the midpoint for the full year, missing analysts’ consensus estimates by 9.1%
- Operating margin 19.8%, down from 23% in the same quarter last year
- Free cash flow margin 23%, up from 19.6% in the same quarter last year
- Market capitalization $12.86 billion
"In the third quarter, Building Climate Solutions continued to deliver strong revenue growth and residential end-markets began stabilizing. However, our margins and results fell short of our expectations, reflecting heightened competitive pressure and the impact of persistent inflation on our costs," said Alok Maskara, Chief Executive Officer. "We are retooling our processes to more effectively pass through cost increases while accelerating productivity. Despite the near-term challenges, we remain confident in our strategy and the long-term resilience of our business model."
Revenue growth
Examining a company’s long-term performance can provide clues about its quality. Any business can post a good quarter or two, but many enduring ones grow for years. Lennox’s revenue grew at a mediocre 6.2% compounded annual growth rate over the last five years, an underwhelming result compared to the rest of the industrials sector. Still, there are things to like about Lennox.
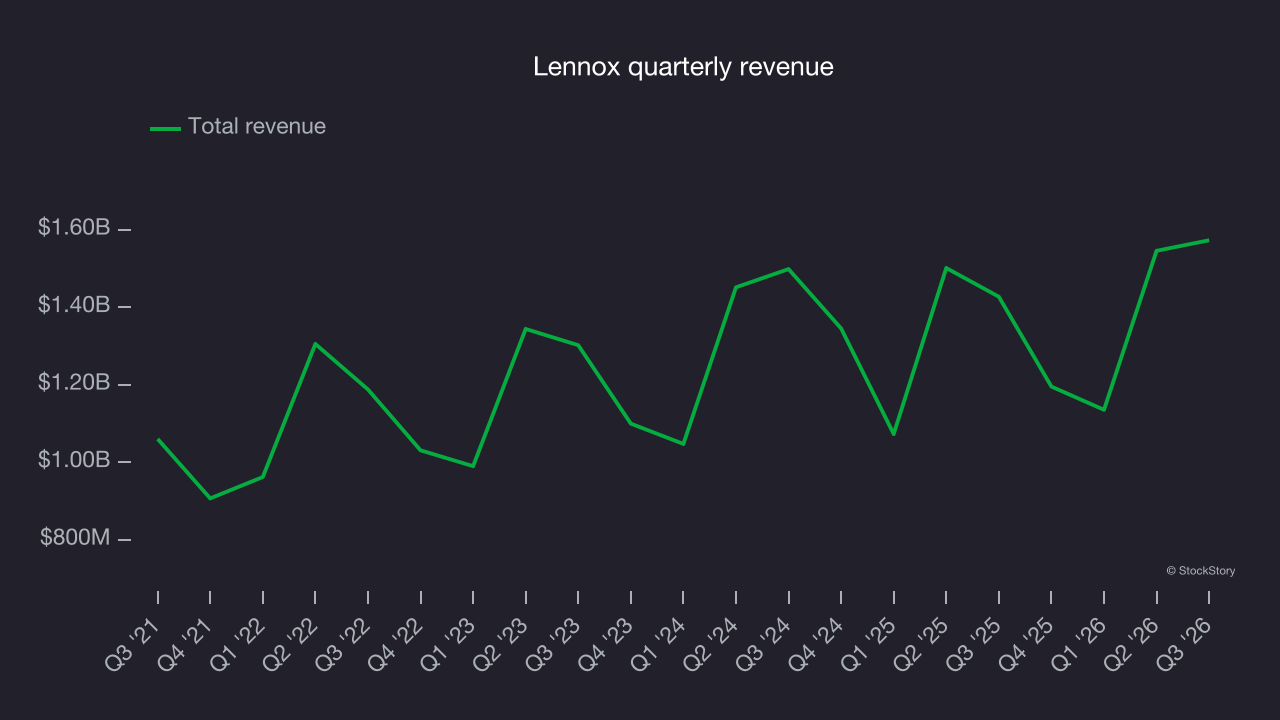
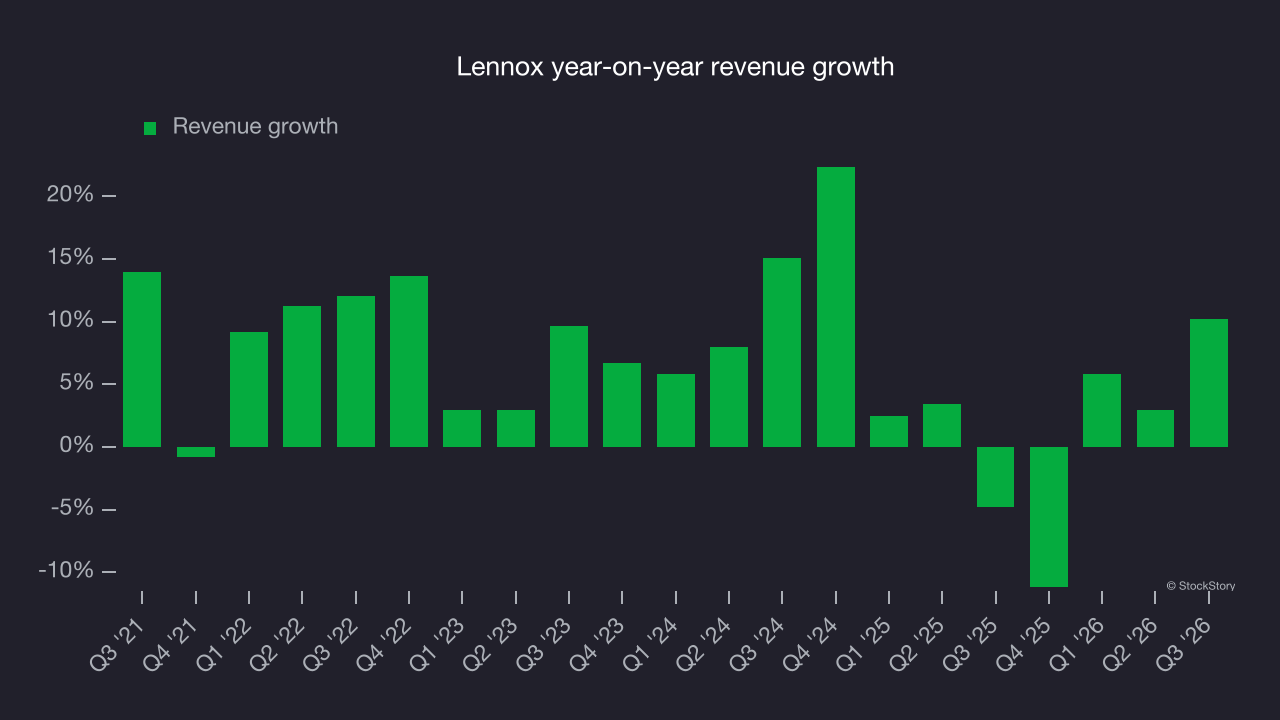
This quarter, Lennox’s year-on-year revenue growth was 10.2%, and its $1.57 billion of revenue was in line with Wall Street’s consensus estimates.
Looking ahead, sell-side analysts expect revenue to grow 7.4% over the next 12 months, according to S&P. Although this projection implies its newer products and services will spur better top-line performance, it is still below average for the sector. At least the company is tracking well in other measures of financial health.
Operating margin
Lennox has operated efficiently over the last five years. It demonstrated high profitability for an industrials business, with an average operating margin of 17.9%. This result was particularly impressive given its low gross margin, which largely reflects what it sells and requires substantial shifts to change meaningfully. Companies have more control over their operating margins, and high operating margins alongside low gross margins indicate well-managed operations.
Analyzing the trend in its profitability, Lennox’s operating margin rose by 4.6 percentage points over the last five years, as its revenue growth gave it operating leverage.
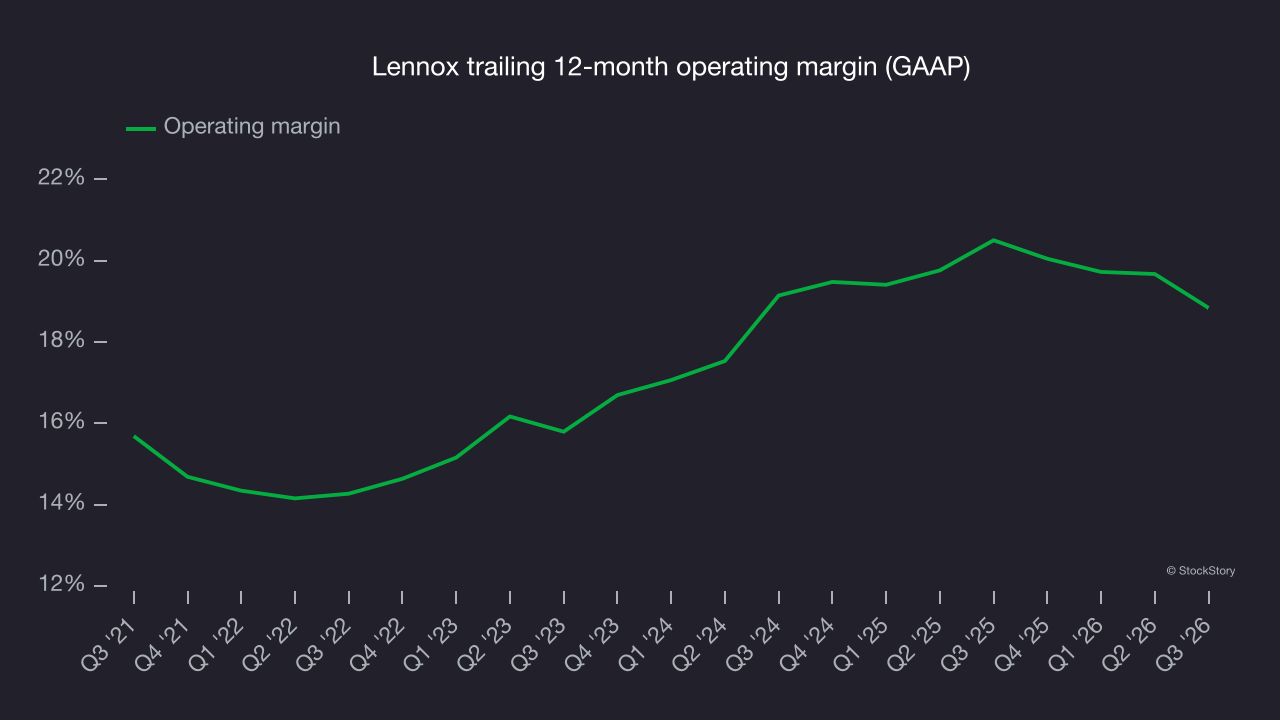
This quarter, Lennox generated an operating margin of 19.8%, down 3.2 percentage points year on year. Its operating margin decreased more than its gross margin, suggesting lower efficiency as expenses such as marketing, R&D and administrative overhead increased.
Earnings per share
We track the long-term change in earnings per share (EPS) for the same reason as long-term revenue growth. Compared to revenue, however, EPS highlights whether a company’s growth is profitable.
Lennox’s EPS grew at an 11.2% compounded annual growth rate over the last five years, higher than its 6.2% annualized revenue growth. This indicates the company became more profitable on a per-share basis as it expanded.
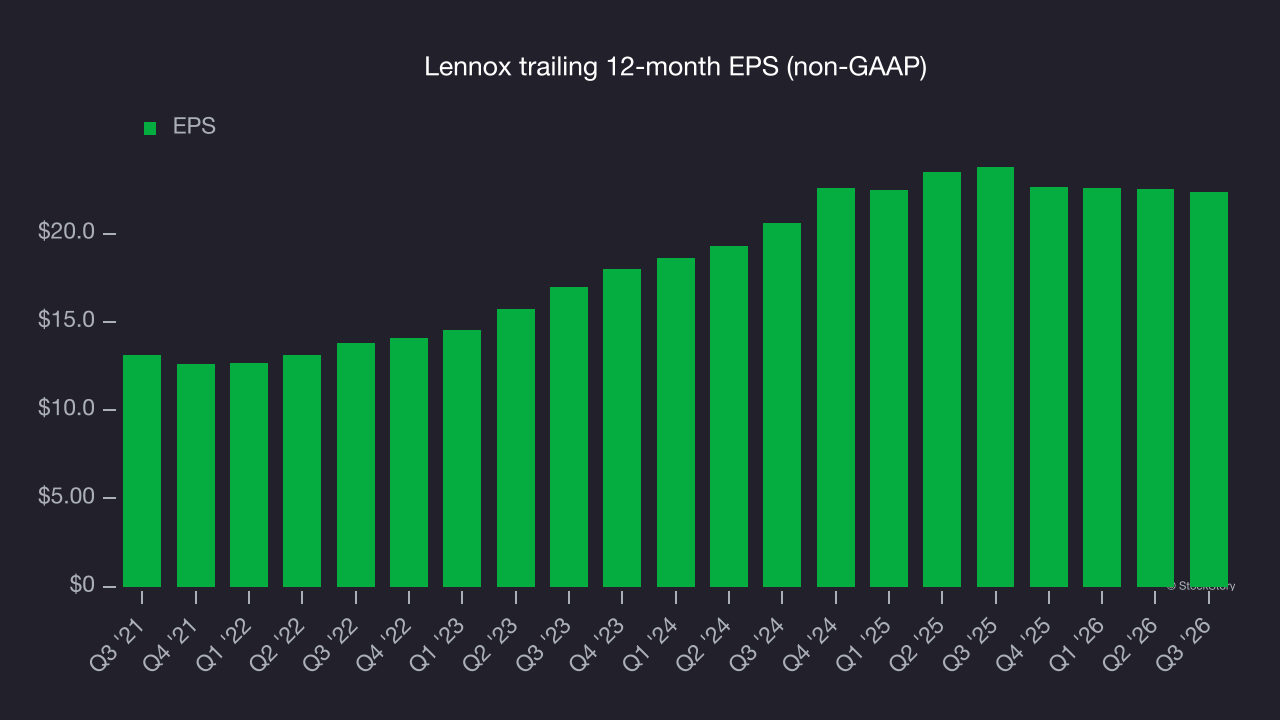
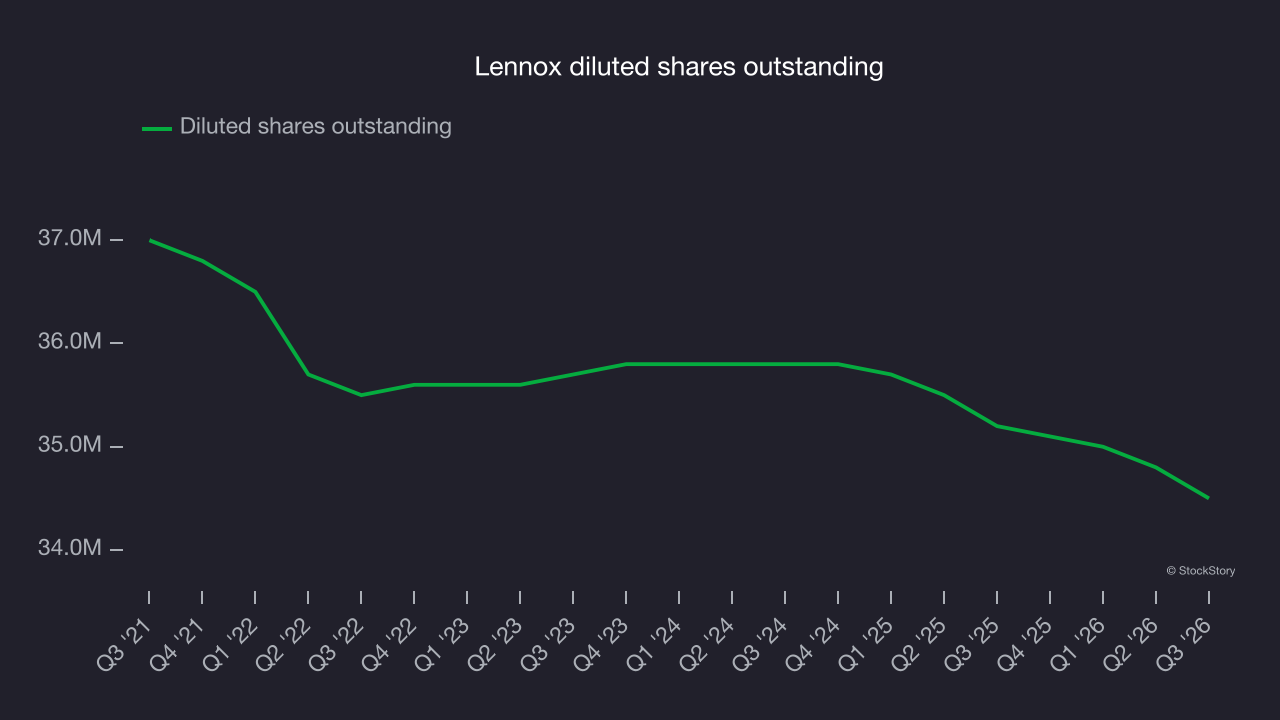
Like with revenue, we analyze EPS over a shorter period to see if we are missing a change in the business.
For Lennox, its two-year annual EPS growth of 4.2% was lower than its five-year trend. That was underwhelming, but the company performed well on other measures of financial health.
In Q3, Lennox reported adjusted EPS of $6.84, down from $6.98 in the same quarter last year. This result missed analysts’ consensus estimates, but long-term adjusted EPS growth matters more than short-term movements. Over the next 12 months, Wall Street expects Lennox’s full-year EPS to grow 12% from $22.36 to $25.05, according to S&P.
Key takeaways from Lennox’s Q3 results
Lennox had few positives to offer this quarter: EPS fell short of Wall Street’s consensus estimates, and full-year EPS guidance also missed expectations. It was a softer quarter overall. Shares fell 4.6% to $355.00 immediately after the report.
Lennox’s latest quarter was underwhelming. One earnings report doesn’t define a company’s quality, though, so assessing the stock at its current price requires a broader view. The latest quarter matters, but not nearly as much as longer-term fundamentals and valuation when deciding whether to buy the stock. For more on Lennox, read our full research report here (it’s free).