


Event-driven interest around Merchants Bancorp
Merchants Bancorp (MBIN) is set to report earnings tomorrow after the market closes, and that timing is what has pulled the stock into focus for many investors.
Recent trading has been choppy for Merchants Bancorp. The share price is down 4.6% over the past month and 8.4% over 90 days. However, the year-to-date share price return of 49.9% and 1-year total shareholder return of 55.0% point to momentum that is still largely intact as investors weigh tomorrow’s earnings against that strong run.
Scan event-driven opportunities around Merchants Bancorp by comparing it with our curated 29 high quality undervalued stocks that highlights companies with similar financial profiles heading into key catalysts.
That mix of recent weakness and a much stronger 1-year run leaves a practical fork in the road for Merchants Bancorp. Is the current pullback enough of an entry point, or does it make more sense to wait and reassess once valuation is more clearly defined?
Price-to-Earnings of 10x: Is it justified for Merchants Bancorp?
On simple valuation math, Merchants Bancorp trades on a P/E of 10x, which screens as cheap when set against both its industry and closest peers.
The P/E ratio compares what you pay per share to the bank's earnings per share. For a diversified financial business like Merchants Bancorp, investors often watch this closely because it reflects how much the market is willing to pay for each dollar of earnings in a sector where profitability and loan quality matter a lot.
Here, the gap is clear. The stock trades on a P/E of 10x while the US Diversified Financial industry sits at 17.2x and the peer group average is 14.7x. That is a sizeable discount, and relative to an estimated fair P/E of 11.6x the current level leaves room for the multiple to move higher if sentiment and fundamentals stay aligned.
Explore the SWS fair ratio for Merchants Bancorp.
Result: Price-to-Earnings of 10x (UNDERVALUED)
Still, the earnings mix at Merchants Bancorp leans heavily on mortgage related activity, and any shift in credit quality or housing demand could quickly challenge the current valuation story.
Find out about the key risks to this Merchants Bancorp narrative.
Another view on Merchants Bancorp’s valuation
The P/E workup paints Merchants Bancorp as cheap, yet the SWS DCF model goes much further. It values the future cash flows at $126.22 per share versus a market price of $49.72. That gap implies a very large discount. If the cash flow view is closer to reality than the earnings multiple, which signal do you treat as more important heading into earnings?
Look into how the SWS DCF model arrives at its fair value.
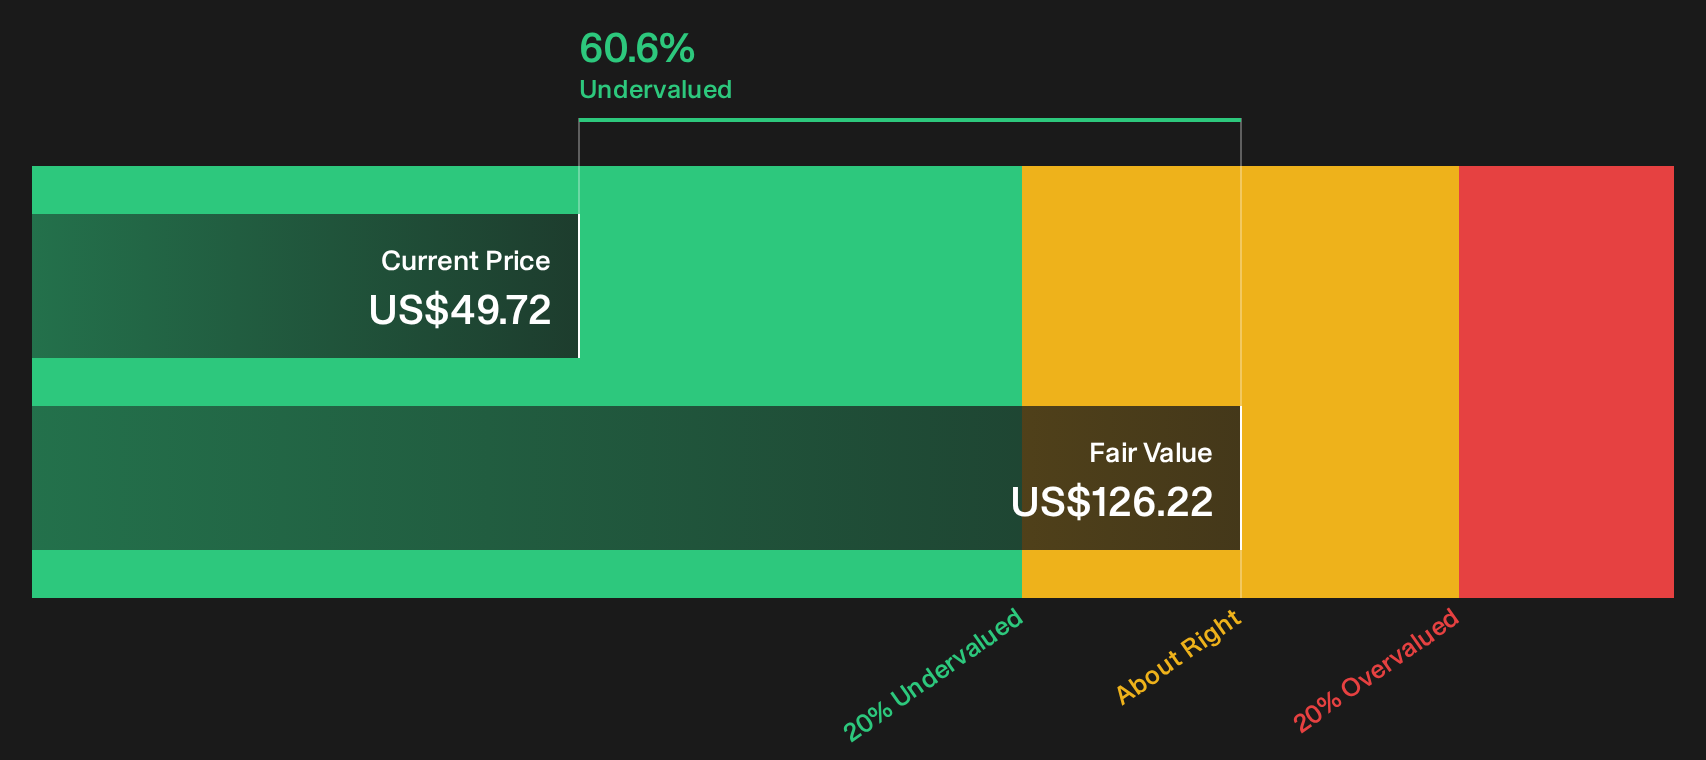
Simply Wall St performs a discounted cash flow (DCF) on every stock in the world every day (check out Merchants Bancorp for example). We show the entire calculation in full. You can track the result in your watchlist or portfolio and be alerted when this changes, or use our stock screener to discover 29 high quality undervalued stocks. If you save a screener we even alert you when new companies match - so you never miss a potential opportunity.
Next Steps
Mixed signals around Merchants Bancorp can feel confusing, so move quickly and test the numbers yourself before headlines and price moves shape your bias for you. To weigh both the upside and the concerns in one place, start by reviewing the 4 key rewards and 2 important warning signs
Looking for more investment ideas beyond Merchants Bancorp?
Do not stop with Merchants Bancorp. Use this earnings moment as a springboard to refresh your watchlist and line up the next set of opportunities.
- Target value opportunities that combine quality and price by scanning our 29 high quality undervalued stocks tailored to highlight stocks with stronger fundamentals than their valuations suggest.
- Prioritise resilience under pressure by reviewing a 30 resilient stocks with low risk scores that filters for businesses with steadier risk profiles and fewer financial red flags.
- Get ahead of the crowd by tracking a 21 high quality undiscovered gems focused on lesser known companies that already show robust fundamentals before attention catches up.
Have feedback on this article? Concerned about the content? Get in touch with us directly. Alternatively, email editorial-team@simplywallst.com