


Liquidity Services (LQDT) has quietly put up a strong multi period share price run, with the stock up over the past week, month, past 3 months and year to date.
With the latest share price at US$44.80 and a 90 day share price return of 16.52%, Liquidity Services is coming off a strong upswing. The 85.58% total shareholder return over the past year signals that momentum has been building for some time.
Scan beyond Liquidity Services and size up other under-the-radar compounders with the 21 high quality undiscovered gems that share strong fundamentals and potential for sustained momentum.
Liquidity Services has put real numbers on the board, and the recent 12 month share price surge reflects that story. The next step is simple: Are you paying a fair price for that strength today?
Price-to-Earnings of 42.2x: Is it justified?
Liquidity Services currently trades on a P/E of 42.2x, which sits well above both its Commercial Services peers and the broader sector despite the recent share price strength.
The P/E ratio compares the stock price to earnings per share. For a business like Liquidity Services, that measure helps you see how much investors are paying today for each dollar of profit the company is generating.
On the numbers provided, LQDT is described as expensive versus the US Commercial Services industry average P/E of 18.8x and a peer group at 27.8x. It is also well ahead of an estimated fair P/E of 22.6x, which is a level the market could potentially move towards if sentiment or growth expectations cool off.
Explore the SWS fair ratio for Liquidity Services.
Result: Price-to-Earnings of 42.2x (OVERVALUED)
Still, Liquidity Services relies heavily on US$331.4m in RSCG revenue and a primarily US customer base, so any pressure there could quickly challenge the current narrative.
Find out about the key risks to this Liquidity Services narrative.
Another View: Liquidity Services Through A Cash Flow Lens
The earnings multiple paints Liquidity Services as expensive. The SWS DCF model tells a different story. On those numbers, LQDT at US$44.80 is trading below an estimated future cash flow value of US$54.83, which suggests the current price may be conservative if those cash flows materialise.
Investors who want to see how that cash flow picture is built line by line can review the full SWS DCF workup for Liquidity Services, starting with the Look into how the SWS DCF model arrives at its fair value.
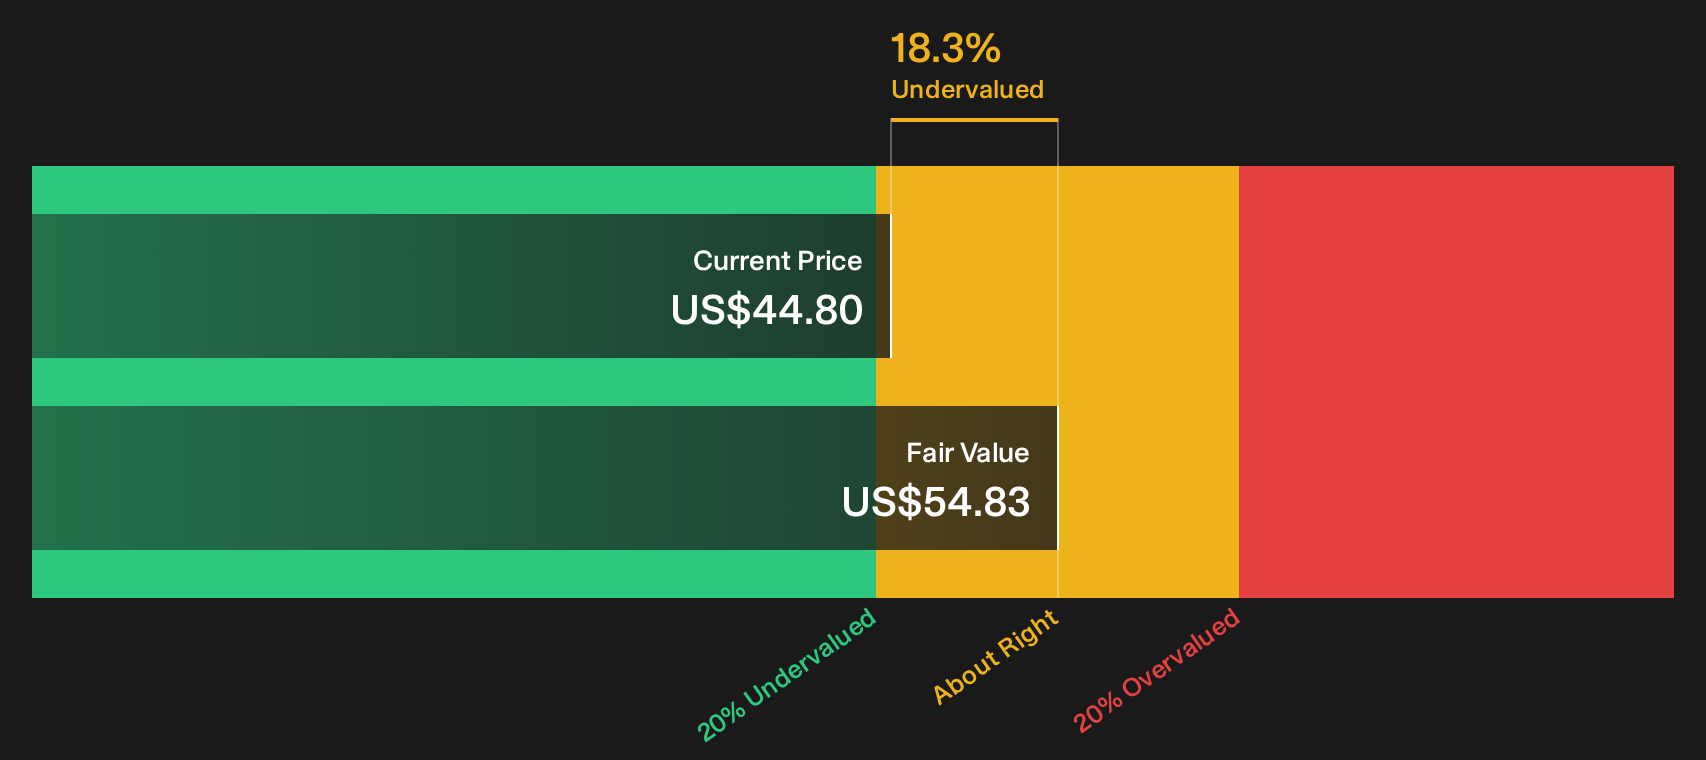
Simply Wall St performs a discounted cash flow (DCF) on every stock in the world every day (check out Liquidity Services for example). We show the entire calculation in full. You can track the result in your watchlist or portfolio and be alerted when this changes, or use our stock screener to discover 29 high quality undervalued stocks. If you save a screener we even alert you when new companies match - so you never miss a potential opportunity.
Next Steps
Strong or stretched, the Liquidity Services story only really clicks when you test the assumptions yourself and pressure test the data driving each metric. To see what the optimism is about, review the 3 key rewards.
Looking for more investment ideas beyond Liquidity Services?
If Liquidity Services has you thinking more broadly about your portfolio, use the Simply Wall Street Screener to uncover fresh opportunities that fit your style.
- Target dependable income and stress test your cash flow plan with a focused set of 5 dividend fortresses.
- Hunt for quality at a sensible entry point by scanning through 29 high quality undervalued stocks.
- Strengthen your downside protection by concentrating on a 30 resilient stocks with low risk scores.
Have feedback on this article? Concerned about the content? Get in touch with us directly. Alternatively, email editorial-team@simplywallst.com