


Peapack-Gladstone Financial stock barely flinched after its Q3 2026 update, edging about 0.6% higher to US$46.17. Yet the earnings story running underneath that move is far more intense than the chart suggests. Quarterly net income of US$18.5 million and basic earnings per share of about US$1.04 point to a bank leaning hard into profitability rather than just coasting on higher rates.
The real tension for long-term holders sits in the valuation strain. A trailing P/E around 13x, a discounted cash flow estimate well below the current quote, and a relatively thin loan loss allowance put the multi-year risk reward firmly in focus despite the upbeat headline results.
Love Peapack-Gladstone Financial's earnings power but uneasy about paying up when a discounted cash flow view signals strain? Focus on a tighter risk reward profile with our 29 high quality undervalued stocks.
Q3 2026 Earnings Summary
- Total Revenue (Q3 2026 vs Q3 2025): US$78.989 million vs. US$65.904 million (higher year over year)
- Net Income (Excl. Extra Items, Q3 2026 vs Q3 2025): US$18.451 million vs. US$9.631 million (higher year over year)
- Basic EPS (Q3 2026 vs Q3 2025): US$1.04 vs. US$0.55 (higher year over year)
- Net Interest Margin, or NIM (Q3 2026 vs Q3 2025): 3.32% vs. 2.81% (higher year over year)
Prefer visual charts instead of another dense wall of numbers? See Peapack-Gladstone Financial's full financial picture, including a clear valuation breakdown in the interactive company report for Peapack-Gladstone Financial.
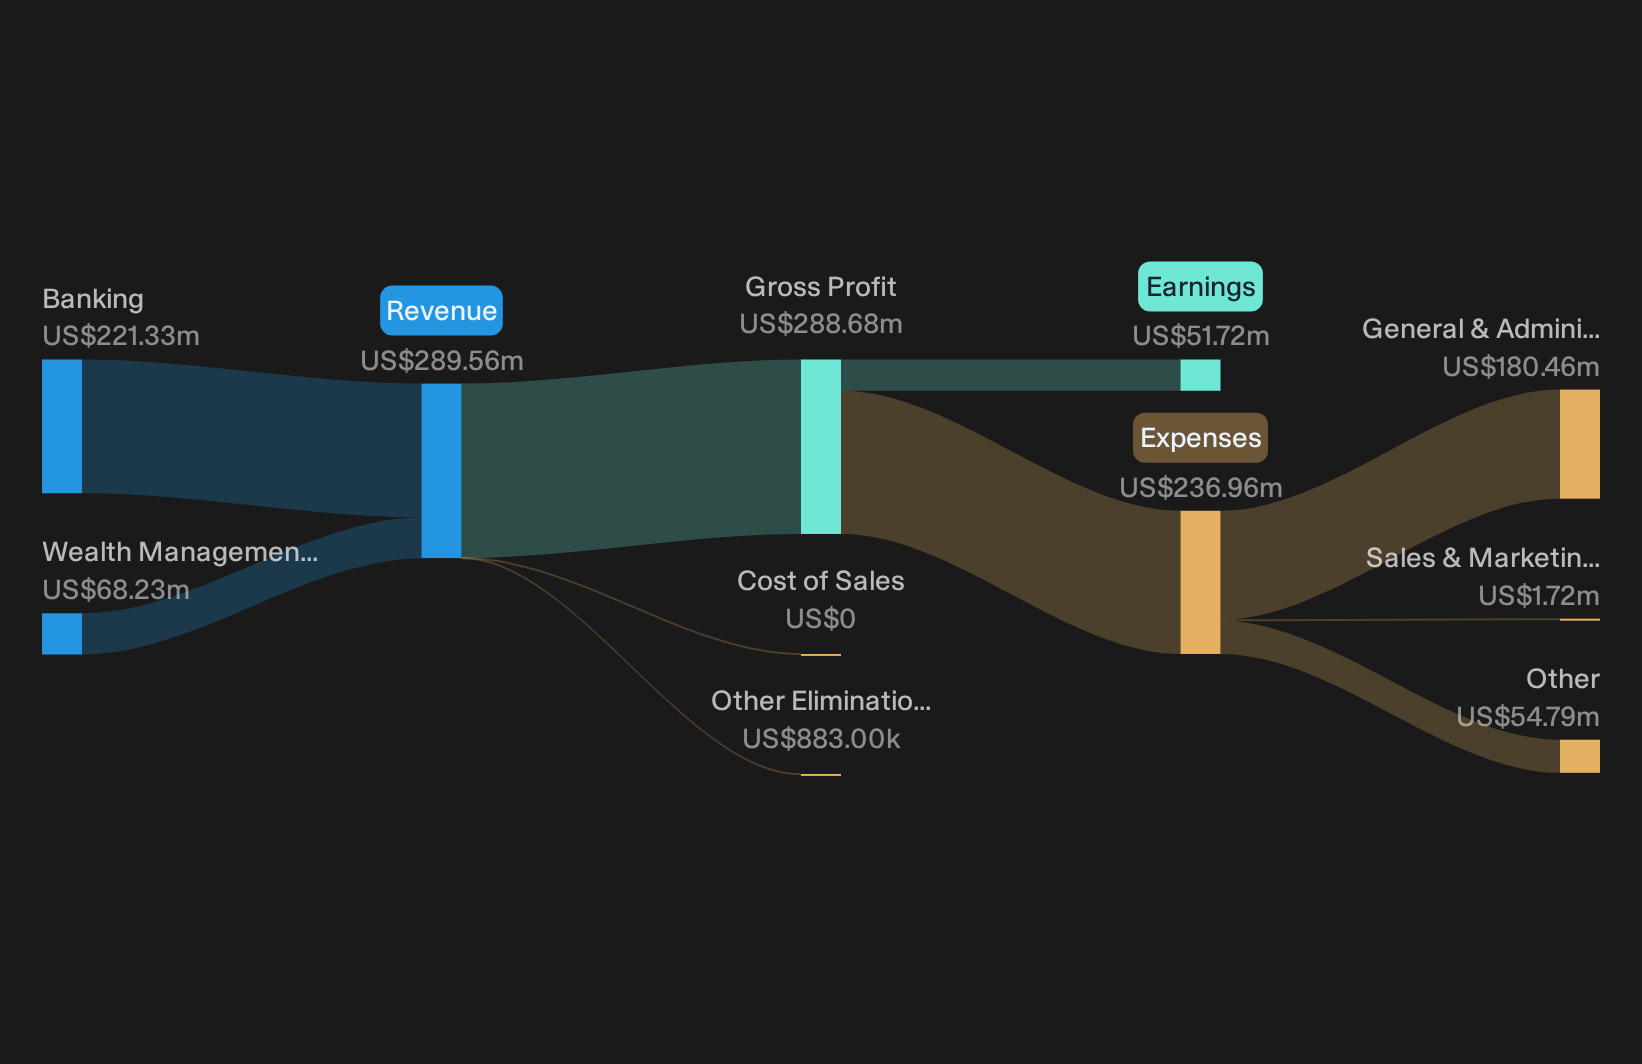
Peapack-Gladstone Financial’s growth engine on trial
"Expansion in the Metro New York market, with more than 1,300 commercial relationships, over US$2.1b of client deposits and over US$1.6b of credit commitments, supports a larger revenue base and potential operating scale benefits for earnings."
Peapack-Gladstone Financial is starting to back this up with hard numbers. Loans reached US$7.1b and deposits US$7.4b, with quarterly growth above management’s US$200 million loan and deposit targets. A net interest margin of 3.34% and core pretax pre-provision earnings of US$32.3 million, alongside an efficiency ratio near 63%, point to early scale benefits rather than growth that only adds complexity.
Testing the Peapack-Gladstone bear case on deposits
"Higher mix of noninterest-bearing deposits, which represented about 49% of quarterly deposit growth and about 2/3 of deposit growth over 12 months, reduces funding costs and supports net interest margin and overall profitability."
The worry is that this low-cost funding mix could reverse once competition heats up. Recent trends go the other way. Noninterest-bearing operating balances increased 18% year over year to roughly US$1.6b, supporting a 3.34% net interest margin even with heavier Federal Home Loan Bank borrowings. Deposit costs on new money sit in the mid 2% range, so pressure exists, but the shift toward operating accounts is not yet eroding profitability.
One Narrative disagrees with today's price. → See where this Narrative says Peapack-Gladstone Financial should trade.
Hunt For Mispriced Earnings Power
Peapack-Gladstone Financial reported a busy quarter that led to a modest share price reaction. The real opportunity is identifying stocks that could be undervalued before the market reflects their earnings power.
- Company 1 - 31% below our estimate - uses a broad advisory platform and recent senior hiring to pursue larger, higher fee capital markets and private transactions.
- Company 2 - 43% below our estimate - converts a record project backlog tied to data centers and modular builds into high utilization work for long term facility owners.
- Company 3 - 25% below our estimate - supplies custom chips and infrastructure software that handle heavy data traffic from cloud, AI and enterprise applications.
Three companies from the same screener. Open the full list of 29 companies trading below our fair value estimates →
Have feedback on this article? Concerned about the content? Get in touch with us directly. Alternatively, email editorial-team@simplywallst.com