


Biogen just reported Q3 2026, and the verdict from the tape was blunt. The stock dropped 3.4% on the day even as revenue reached US$2.8b and the growth portfolio delivered strong pharmaceutical sales.
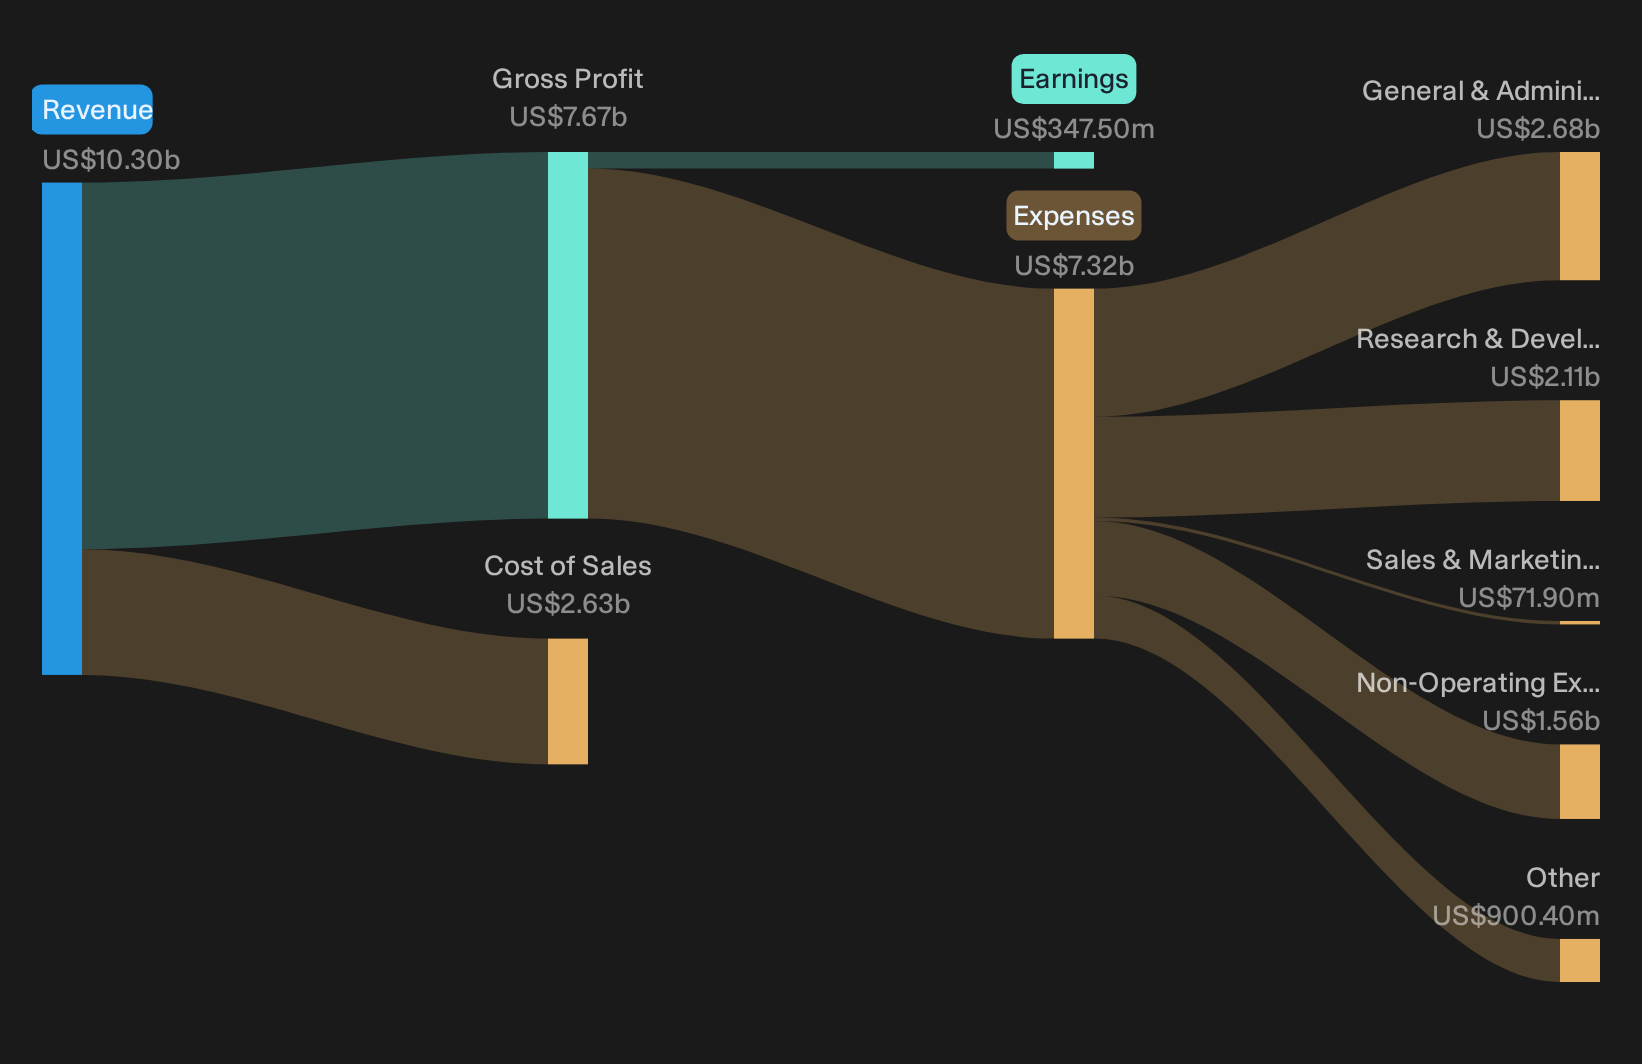
The market latched onto the headline quarterly loss per share of US$0.14 and treated it as a verdict on the whole business. That move looks more emotional than forensic, because the earnings hit was heavily shaped by acquired in process research and development charges and other one off items rather than a collapse in demand or cash generation.
Like the underlying Biogen story but wary of earnings that swing around one off charges? Filter for companies where reported profit lines up more cleanly with cash generation using the list of solid balance sheet and fundamentals stocks (24 results).
Q3 2026 Earnings Summary
- Revenue (Q3 2026 vs. Q3 2025): US$2,804.1m vs. US$2,534.7m (up 10.6%)
- Net Income/Loss (Q3 2026 vs. Q3 2025, excl. extra items): loss of US$20.6m vs. profit of US$466.5m (swing into loss)
- Basic EPS (Q3 2026 vs. Q3 2025): loss of US$0.14 per share vs. earnings of US$3.18 per share (sharp EPS reversal)
- Trailing 12-Month Net Profit Margin (Q3 2026 vs. Q3 2025): 3.4% vs. 16% (margin sharply lower year on year)
Biogen’s newer drugs now drive nearly two‑thirds of core pharma revenue. Ask Charlie what’s really behind Biogen’s 49% growth portfolio surge.
Biogen growth engine: breadth vs MS erosion
The bullish pitch is that Biogen’s newer neurology and immunology drugs can carry the load as MS drifts lower.
"Growing uptake of Biogen’s multi-product growth portfolio, which generated over US$1b of revenue in Q2 2026 and has now exceeded the multiple sclerosis portfolio, supports the idea that a broader base of neurology and immunology brands can increasingly carry total revenue and help stabilise earnings."
Q3 backs up that shift. Growth products delivered about US$1.3b, roughly 63% of core pharma revenue, and core pharma itself rose 18% year on year. The drag comes from profitability. Non GAAP core operating expenses climbed 27% year on year and heavy acquired R&D charges flipped GAAP earnings into a small loss.
Biogen risk check: launch dependence and cost strain
The bear story focuses on whether MS decline, launch reliance and higher spending blunt that upbeat mix shift.
"Despite claims of pipeline advancement, Biogen's future growth remains heavily dependent on the commercial performance of a small number of new launches such as LEQEMBI, SKYCLARYS and ZURZUVAE."
Q3 numbers underline that concentration. LEQEMBI, SKYCLARYS, SPINRAZA high dose and Apellis assets explain most of the US$1.3b growth portfolio. Legacy MS drugs like VUMERITY and TYSABRI look flat to weaker, so erosion risk is visible. Cost control is not yet a clear offset. Core operating expenses increased faster than revenue and large IPR&D charges and amortisation pushed trailing 12 month margins down to 3.4%.
One Narrative has put a figure on that disagreement. → See the Narrative with its lower Fair Value, assumptions and all.
Hunt Quiet Disconnects In Earnings
Biogen shows how clean revenue progress can still sit alongside messy reported earnings and a sharp price reaction. The real opportunity is spotting stocks that could be undervalued before that gap closes.
- Company 1 - 34% below our estimate - uses record power systems demand and long-term data center contracts to fill new high-horsepower engine capacity.
- Company 2 - 32% below our estimate - targets rising data center spending by pairing GPU design with a software stack for AI workloads.
- Company 3 - 28% below our estimate - turns a record funnel of complex aerospace, defense and healthcare manufacturing wins into higher value programs with tight cash discipline.
Those are three of them. See all 29 potentially undervalued companies →
Have feedback on this article? Concerned about the content? Get in touch with us directly. Alternatively, email editorial-team@simplywallst.com