


Chubb (CB) is back in focus after releasing third quarter 2026 results, reporting net income of US$2.84b and diluted earnings per share of US$7.30 from continuing operations, both slightly above last year.
At a recent share price of US$355.50, Chubb’s short-term picture is a mix of a small 1-day share price decline of 0.21% and a 1-month share price return of 7.28%. The 1-year total shareholder return of 29.45% and 5-year total shareholder return of 98.89% point to momentum that longer term investors will pay close attention to as earnings beats and recent leadership changes in Global Claims reshape expectations for growth and risk management.
Scan how Chubb compares with other insurers showing strong recent momentum and robust fundamentals by reviewing our curated list of solid balance sheet and fundamentals (24 results)
Bulls view Chubb’s recent run and earnings beat as evidence the stock deserves a premium. Bears point instead to softer underwriting income and a richer starting price. Which story does the current valuation actually support?
Most Popular Narrative: 3% Undervalued
Chubb’s most followed valuation view pegs fair value at about $365.91 per share, just above the last close of $355.50. This frames the current price as only modestly below that narrative estimate while still reflecting strong recent returns.
The numbers imply that at the current share price, investors are paying for a company that already delivers 18.2% core operating EPS growth, a 17.1% rise in tangible book value per share, and ongoing buybacks under a US$7.5b repurchase program. Together these factors support the view that Chubb stock is fairly valued yet still treated as bullish in this narrative.
See why 84 investors see Chubb as 3% undervalued.
Result: Fair Value of $365.91 (UNDERVALUED)
Still, the story around Chubb can change quickly if casualty loss cost inflation keeps outpacing pricing or if shedding underpriced property business trims premium scale faster than expected.
Find out about the key risks to this Chubb narrative.
Another View: Chubb Looks Expensive On Earnings
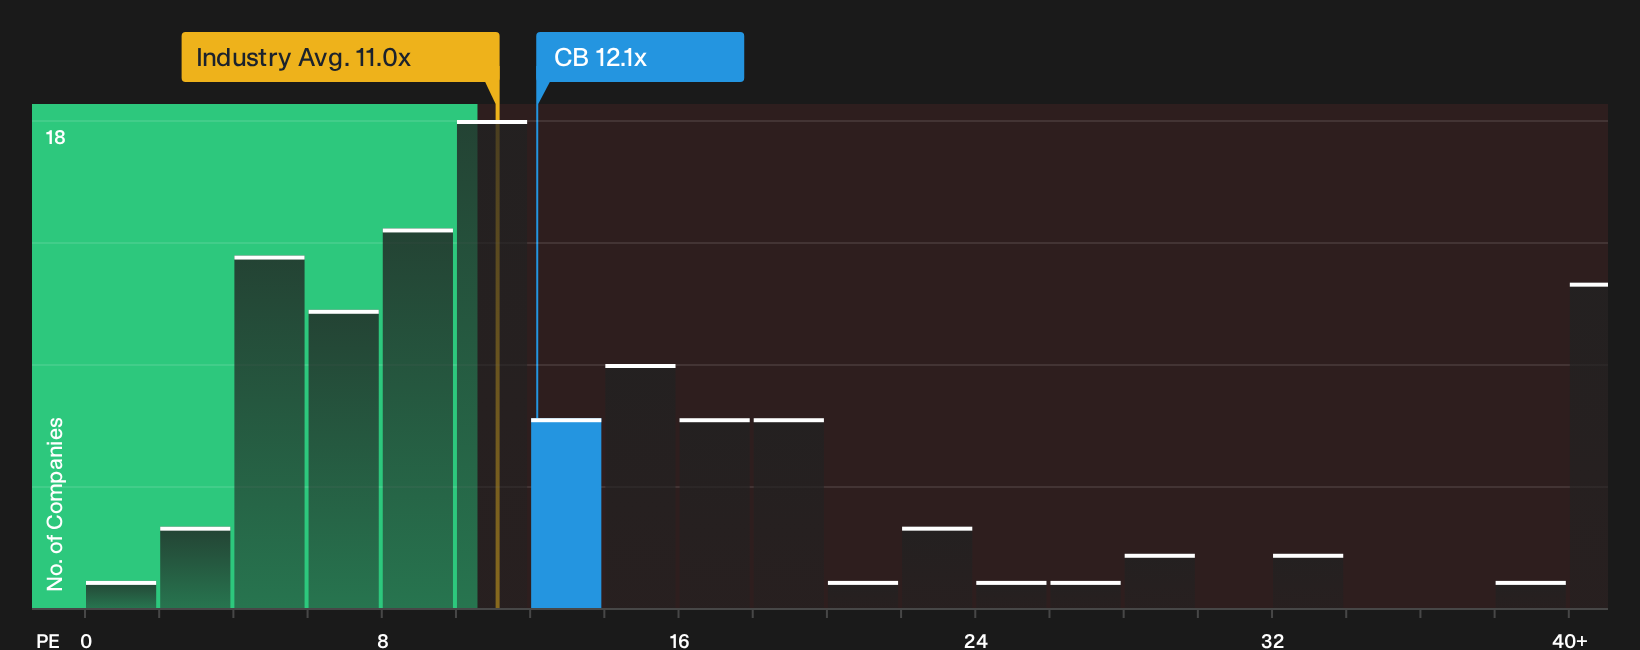
There is a very different message when you swap the fair value narrative for simple earnings multiples. Chubb trades on a P/E of 12.1x, compared with 8.5x for peers and 11x for the broader US Insurance group, while the fair ratio points to 10.7x instead.
That gap means investors are paying a richer price than both direct competitors and the fair ratio the market could move towards, even as analyst models see flat to slightly weaker earnings ahead. Is that premium a comfortable margin of safety or a thin cushion if sentiment cools?
For a closer look at how these earnings based metrics stack up against quality, growth expectations, and sector norms, See what the numbers say about this price — find out in our valuation breakdown.
Next Steps
If the mixed signals around Chubb have you torn, do not sit on the fence while the data is right in front of you. Go through the key metrics, weigh both the concern around risks and the optimism around potential rewards, then ground your stance with the 2 key rewards and 2 important warning signs.
Looking for more investment ideas beyond Chubb?
If Chubb has sharpened your focus on quality, you can broaden your watchlist with fresh ideas tailored to different goals and risk levels using the Simply Wall St screener.
- Target growth at a discount by reviewing our curated pool of 20 high quality undiscovered gems that combine strong fundamentals with lower market attention.
- Balance opportunity and defense by scanning a diversified 30 resilient stocks with low risk scores designed to keep downside in check while still aiming for sensible returns.
- Strengthen your income playbook by reviewing a focused 6 dividend fortresses built around higher yields and support from underlying financials.
Have feedback on this article? Concerned about the content? Get in touch with us directly. Alternatively, email editorial-team@simplywallst.com