


Stock Yards Bancorp (SYBT) just posted third quarter results that combined higher net interest income and earnings with a sharp jump in net charge offs, giving investors a mixed but important update on credit costs.
The solid third quarter update came on a weaker trading day for Stock Yards Bancorp, with the share price falling 2.0% on the day and down about 9.7% over 90 days. However, the year-to-date share price return of 17.8% and 1-year total shareholder return of 19.0% still suggest momentum that has cooled rather than reversed, particularly when considered alongside a very large 3-year total shareholder return of about 2x and a 5-year total shareholder return of 33.6%.
Scan beyond Stock Yards Bancorp and compare this credit and earnings story with 32 resilient stocks with low risk scores, which have been filtered for resilience when loan losses start to bite.
Stock Yards Bancorp now pairs a strong earnings line with a much higher credit cost and a share price that has cooled after a strong run. Is that combination still attractive enough to justify taking on new risk?
Preferred P/E of 16x for Stock Yards Bancorp: Is it justified?
On valuation, Stock Yards Bancorp trades on a P/E of 16x while the last close sits at $76.81. This places the shares on a richer footing than many peers and suggests investors are paying up compared to both the wider US Banks group and the stock's own fair ratio estimate.
The P/E, or price to earnings ratio, compares what you pay per share to the earnings that Stock Yards Bancorp generates for each share. For a lender and wealth manager that already reports high quality earnings and a profit margin of 35.7%, a higher P/E can reflect a willingness from the market to pay more for those profits and for the perceived stability of the underlying franchise.
There is a clear trade off. The current 16x P/E sits above the estimated fair P/E of 11x, which points to a level the valuation could drift toward if sentiment cools. It also comes in well ahead of the US Banks industry average of 11.5x and a peer average of 11.4x, which shows the stock carries a strong premium over comparable banking companies.
Explore the SWS fair ratio for Stock Yards Bancorp.
Result: Price-to-earnings of 16x (OVERVALUED)
Still, rising net charge offs and a richer 16x P/E leave Stock Yards Bancorp exposed if credit costs worsen or if investor appetite for premium bank valuations cools.
Find out about the key risks to this Stock Yards Bancorp narrative.
Another view on Stock Yards Bancorp’s value
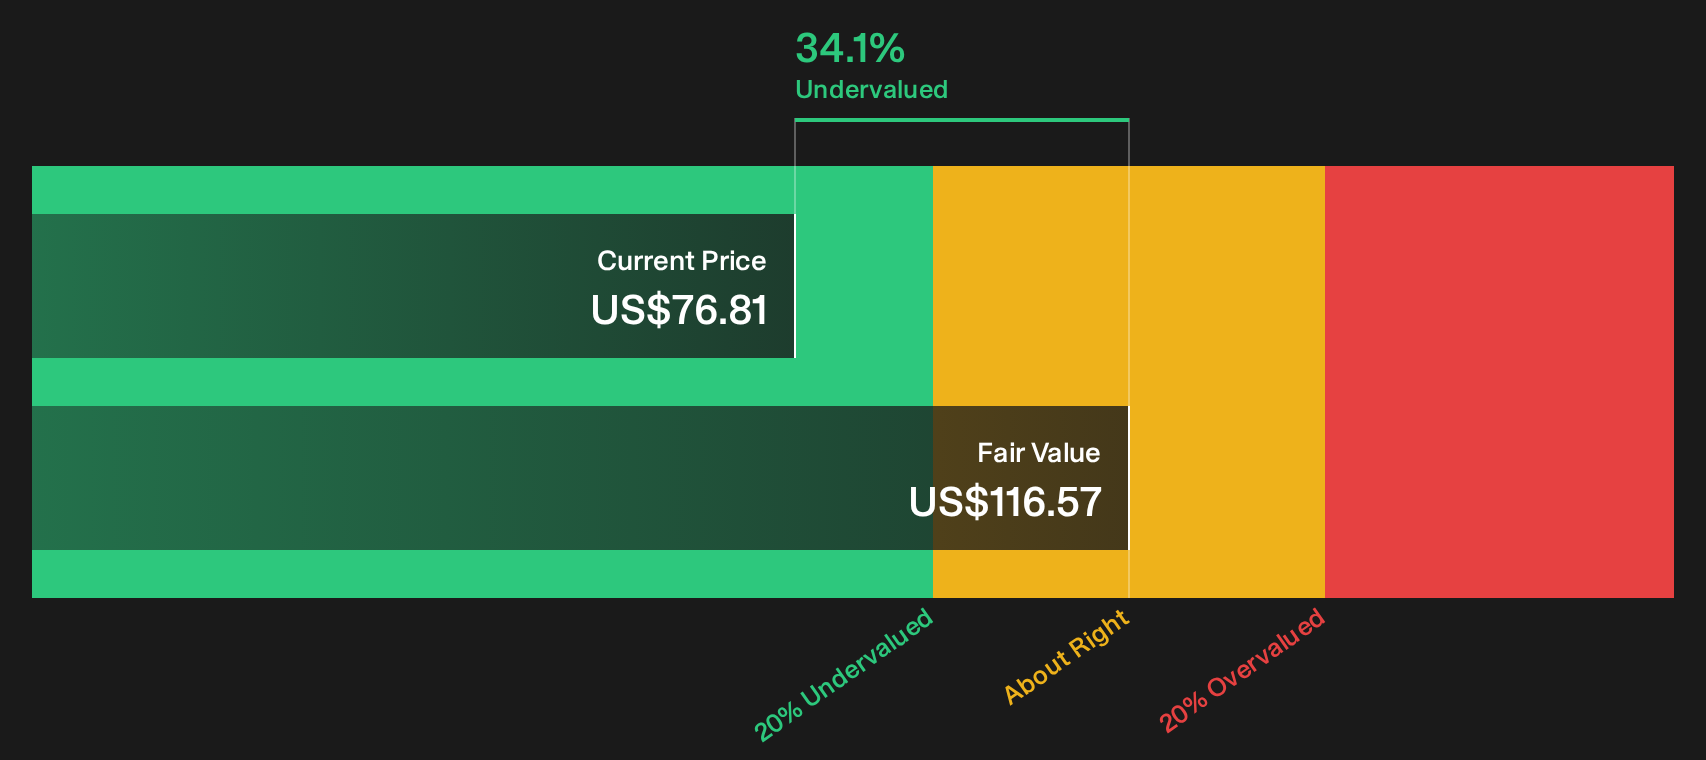
The 16x P/E paints Stock Yards Bancorp as expensive relative to peers, yet the SWS DCF model points the other way. On that cash flow view, the shares at $76.81 sit below an estimated value of $116.57, which frames the current quote as undervalued instead of rich.
That clash between earnings based pricing and cash flow based value puts the burden on which yardstick you trust more: the multiple or the model, and whether the gap reflects opportunity or a warning that assumptions may be too generous.
Look into how the SWS DCF model arrives at its fair value.
Simply Wall St performs a discounted cash flow (DCF) on every stock in the world every day (check out Stock Yards Bancorp for example). We show the entire calculation in full. You can track the result in your watchlist or portfolio and be alerted when this changes, or use our stock screener to discover 26 high quality undervalued stocks. If you save a screener we even alert you when new companies match - so you never miss a potential opportunity.
Next Steps
Mixed signals on Stock Yards Bancorp can easily pull you in either direction, so check the data yourself, weigh the trade off between risk and reward, and ground your decision in the full picture of 4 key rewards and 1 important warning sign.
Looking for more Stock Yards Bancorp investment ideas?
If Stock Yards Bancorp has sharpened your focus on risk, reward, and price, do not stop here. Broaden your opportunity set with targeted screeners designed to surface specific edge.
- Target stability first and see which resilient shares clear strict risk filters using the 32 resilient stocks with low risk scores.
- Hunt for value and scan a 26 high quality undervalued stocks that pairs stronger fundamentals with prices that sit below fair estimates.
- Put cash flow to work and review a 6 dividend fortresses that combines higher yields with an emphasis on durability.
Have feedback on this article? Concerned about the content? Get in touch with us directly. Alternatively, email editorial-team@simplywallst.com