


HBT Financial (HBT) drew fresh attention after third quarter results topped analyst expectations on earnings, supported by higher net interest income and net income. This was followed by a confirmed quarterly dividend of $0.25 per share.
The stronger third quarter and new dividend decision followed a year in which HBT Financial’s 1-year total shareholder return of 58.48% significantly exceeded its 1-year share price return, supported by prior dividends and buybacks that increased overall investor gains.
See how HBT Financial’s earnings beat and dividend story compare with other hand-picked regional lenders by reviewing the list of solid balance sheet and fundamentals (24 results).
After a 1 year total return above 58% and a fresh earnings beat, HBT Financial has already rewarded patient holders. The next step is to evaluate whether the current valuation still offers an attractive risk-reward profile for new capital.
Price-to-Earnings of 14.8x: Is it justified?
HBT Financial trades on a P/E of 14.8x, which sits above the US Banks peer average of 11.5x even though the last close sits at $36.40.
The P/E ratio compares the current share price with earnings per share and gives you a quick sense of how much investors pay for each dollar of profit. For a regional bank like HBT Financial, this measure often reflects expectations around loan quality, deposit stability, and how consistently profits are generated across cycles.
HBT Financial is described as good value against an estimated fair P/E of 15x, so the current 14.8x level sits close to a level the market could move towards. At the same time, that 14.8x reading is described as expensive when lined up against the 11.5x average for US banks. This suggests the market is assigning a premium relative to peers that only looks modest when set against the fair ratio estimate.
Compared with the broader US Banks industry, the current P/E of 14.8x is clearly higher than the 11.5x peer average. This points to stronger confidence in HBT Financial’s earnings profile relative to many regional lenders.
Explore the SWS fair ratio for HBT Financial.
Result: Price-to-Earnings of 14.8x (OVERVALUED).
Still, a richer P/E and a concentrated regional footprint leave HBT Financial exposed if credit quality weakens or if funding costs pressure profitability.
Find out about the key risks to this HBT Financial narrative.
Another View: HBT Financial Through A Cash Flow Lens
The P/E of 14.8x paints HBT Financial as slightly expensive against US banks, yet fair against its own earnings profile. The SWS DCF model tells a very different story. On that measure, the shares at $36.40 trade well below an estimated future cash flow value of $78.28, which points to a wide valuation gap that long term holders may find hard to ignore. Which signal do you trust more: the income statement multiple or the cash flow math?
Look into how the SWS DCF model arrives at its fair value.
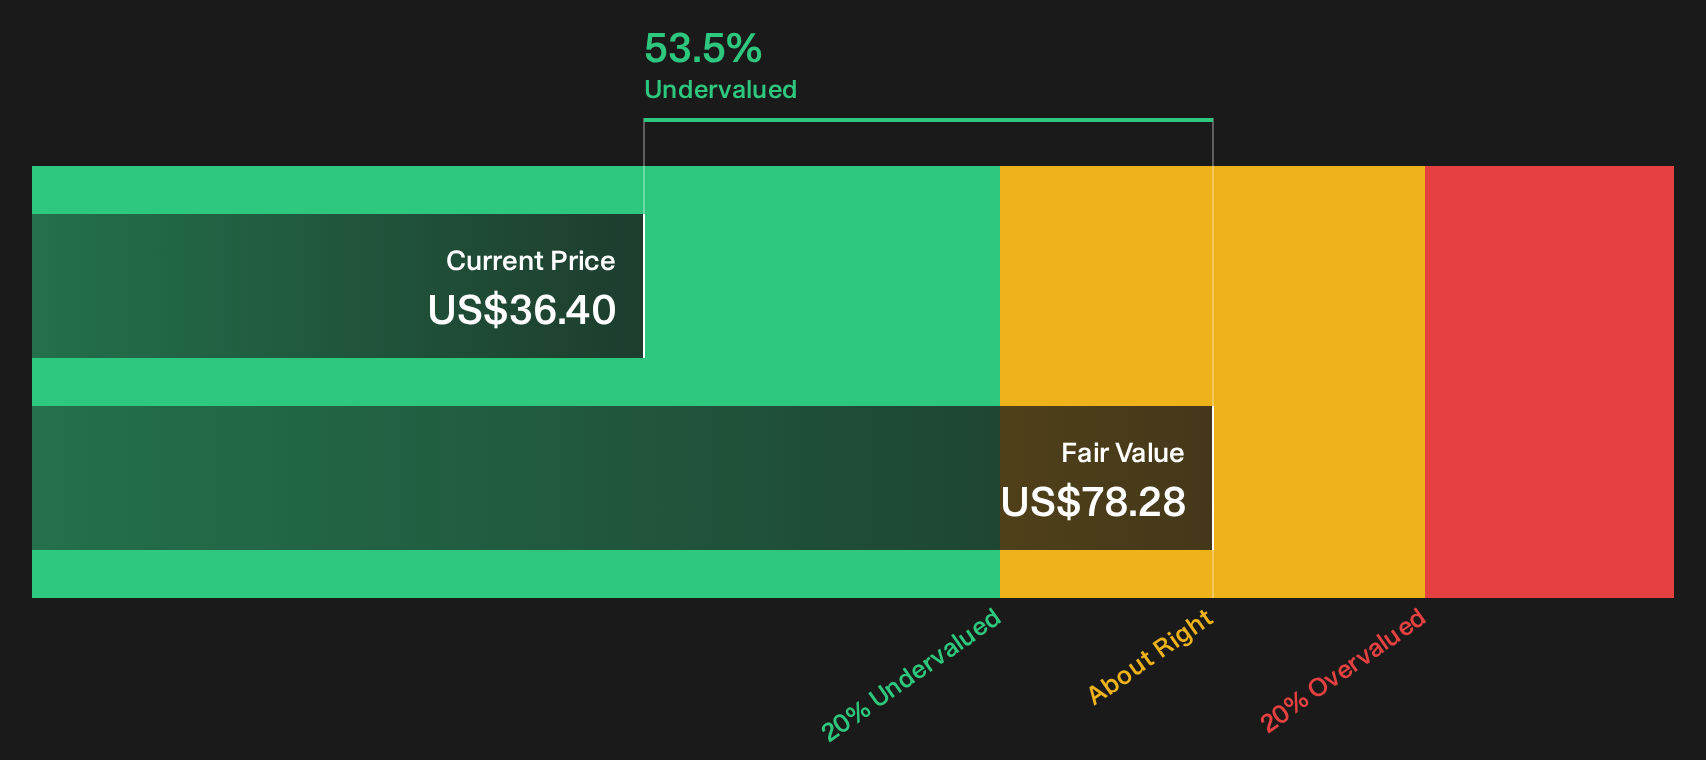
Simply Wall St performs a discounted cash flow (DCF) on every stock in the world every day (check out HBT Financial for example). We show the entire calculation in full. You can track the result in your watchlist or portfolio and be alerted when this changes, or use our stock screener to discover 26 high quality undervalued stocks. If you save a screener we even alert you when new companies match - so you never miss a potential opportunity.
Next Steps
Strong results can make any story feel one sided, yet HBT Financial clearly carries both risks and potential upside that matter for fresh money. Take a moment to test the data against your own expectations, then weigh both sides by starting with the 3 key rewards and 1 important warning sign
Looking for more HBT Financial style investment ideas?
If you stop with HBT Financial, you risk missing other solid opportunities. Let the data guide your next move with a few focused screens.
- Target resilience by scanning for companies that pair strong fundamentals with healthy balance sheets using the list of solid balance sheet and fundamentals (24 results).
- Hunt for value by zeroing in on quality businesses trading below what their cash flows and financial strength might justify through the 26 high quality undervalued stocks.
- Build a steadier income stream by filtering for companies that offer higher yields with support from robust financial profiles via the 6 dividend fortresses.
Have feedback on this article? Concerned about the content? Get in touch with us directly. Alternatively, email editorial-team@simplywallst.com