


AQ Group (OM:AQ) has drawn fresh attention after reporting third quarter and nine month 2026 results that show higher sales, revenue, and net income than the same periods a year earlier.
AQ Group’s SEK236.0 share price sits after a run where the stock has gained 15.69% on a 90 day share price return and 27.29% year to date, while the 1 year total shareholder return of 22.80% and a very large 5 year total shareholder return suggest momentum has been in place for some time as investors react to stronger earnings and an active acquisition pipeline.
Scan how AQ Group’s earnings momentum compares with other industrial manufacturers by checking our curated list of list of solid balance sheet and fundamentals (203 results)
AQ Group now looks like a stronger industrial platform after this earnings run and acquisition push. The real question is whether the current SEK236 price already reflects that quality or still leaves some value on the table.
Most Popular Narrative: Fairly Valued
AQ Group’s most followed narrative pegs fair value at SEK237, almost exactly in line with the SEK236 closing price. As a result, the story hinges more on execution than on a big pricing gap.
The shift toward higher complexity, engineering intensive products such as more advanced transformers, solid state transformer prototypes and supercapacitor cabinets, together with the raised profit before tax margin target from 8% to above 10%, points to a continued focus on product mix that supports group net margins.
See why 5 investors see AQ Group as 0% undervalued.
Result: Fair Value of SEK237 (ABOUT RIGHT)
Still, weak utilization at factories in Mexico, New York and India, together with pressure on gross margins from material intensive transformer sales, could challenge that fair value story.
Find out about the key risks to this AQ Group narrative.
Another View: AQ Group Looks Pricey On Earnings
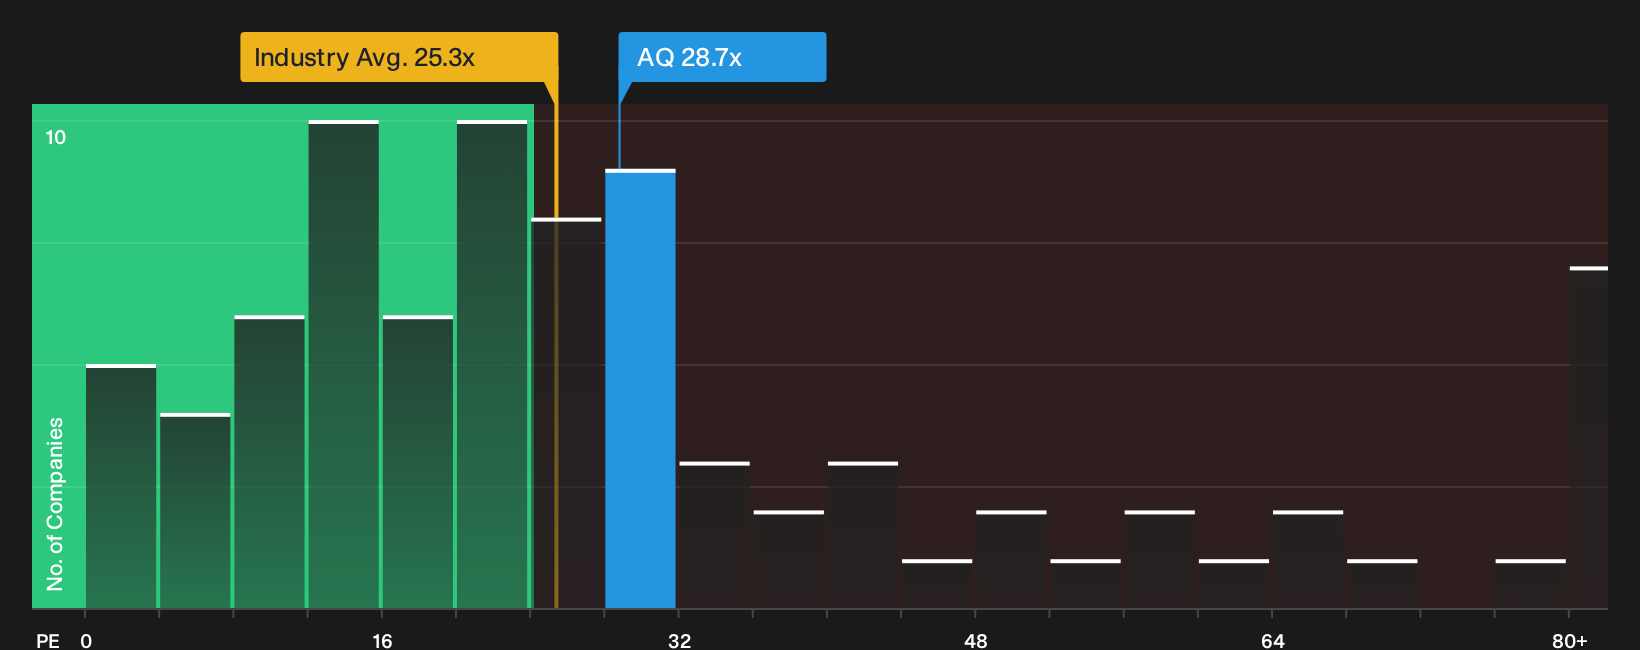
On a simple earnings yardstick, AQ Group starts to look expensive. The stock trades on a P/E of 28.7x, above the European electrical industry at 24.5x and well above a fair ratio of 22.4x. That gap points to valuation risk if sentiment cools or execution slips.
For readers weighing whether this richer P/E is justified by the story around AQ Group, it is worth going deeper into how that ratio compares with peers and where the fair ratio suggests the market could eventually settle, See what the numbers say about this price — find out in our valuation breakdown.
Next Steps
If the mix of fair value and richer earnings multiples around AQ Group feels finely balanced, move fast and test the data against your own view by digging into the 2 key rewards.
Looking for more AQ Group style investment ideas?
Do not stop with AQ Group alone. Use the Simply Wall Street Screener to pressure test your thesis, compare alternatives, and uncover opportunities you might otherwise overlook.
- Target resilience by scanning a 228 resilient stocks with low risk scores that may suit investors who prioritise capital protection alongside measured upside potential.
- Hunt for quality at a discount by reviewing a 191 high quality undervalued stocks that filters for robust balance sheets and stronger fundamental profiles.
- Build a watchlist of dependable income candidates by tracking a 226 dividend fortresses that focuses on higher yielding payout profiles.
Have feedback on this article? Concerned about the content? Get in touch with us directly. Alternatively, email editorial-team@simplywallst.com