


- Tele2 reported third quarter 2026 sales of SEK 7,603 million and net income of SEK 1,410 million, with nine month figures of SEK 22,240 million in sales and SEK 9,007 million in net income, including higher basic and diluted earnings per share from continuing operations than a year earlier.
- The sharp rise in nine month earnings per share from continuing operations, from SEK 4.85 to SEK 12.97 basic, reflects how recent cost and efficiency efforts are feeding through to reported profitability.
- This article examines how Tele2's investment narrative, which focuses on cost efficiency and cash generation, is influenced by the strong nine month earnings uplift.
Scan for other telecoms and cash-generative operators showing similar earnings momentum using our hand picked list of solid balance sheet and fundamentals (205 results)
Tele2 Investment Narrative Recap
To own Tele2, an investor needs to believe that its cost and AI driven efficiency program can keep earnings resilient while Swedish consumer markets stay highly competitive. The latest quarter, with SEK 2.03 basic EPS from continuing operations, supports the idea that cost work is still flowing through. In the near term, the key swing factor is whether underlying service revenue in Sweden and the Baltics can offset pressure in fixed broadband.
The biggest risk right now is that Tele2 runs out of easy efficiency wins. Transformation has already leaned heavily on staff cuts and supplier renegotiations. If incremental savings slow while open network broadband remains tough, earnings could become more sensitive to any dip in demand or higher lease and interest costs.
The most relevant update is Tele2's nine month result to September 2026, which showed SEK 22,240 million of sales and SEK 9,007 million of net income from continuing operations. Basic EPS from continuing operations of SEK 12.97 for the period, versus SEK 4.85 a year earlier, highlights how aggressively lower costs and automation are feeding through to the income statement.
For a catalyst checklist, that jump in profit is important because it interacts with Tele2's capital light model, tower leases and dividend heavy policy. Strong earnings help support leverage inside the stated ceiling and keep equity free cash flow robust, though a high debt load and an unstable dividend record still sit in the background as operational and capital allocation risks to watch.
Tele2's current analyst narrative points to SEK 31.8 billion in revenue and SEK 6.1 billion in earnings by 2029, built on an assumed 1.8% yearly revenue growth rate and an earnings decline of SEK 4.0 billion from SEK 10.1 billion today to the 2029 consensus level.
Uncover why Tele2's fair value indicates a 10% potential upside to its current price that may not last much longer.
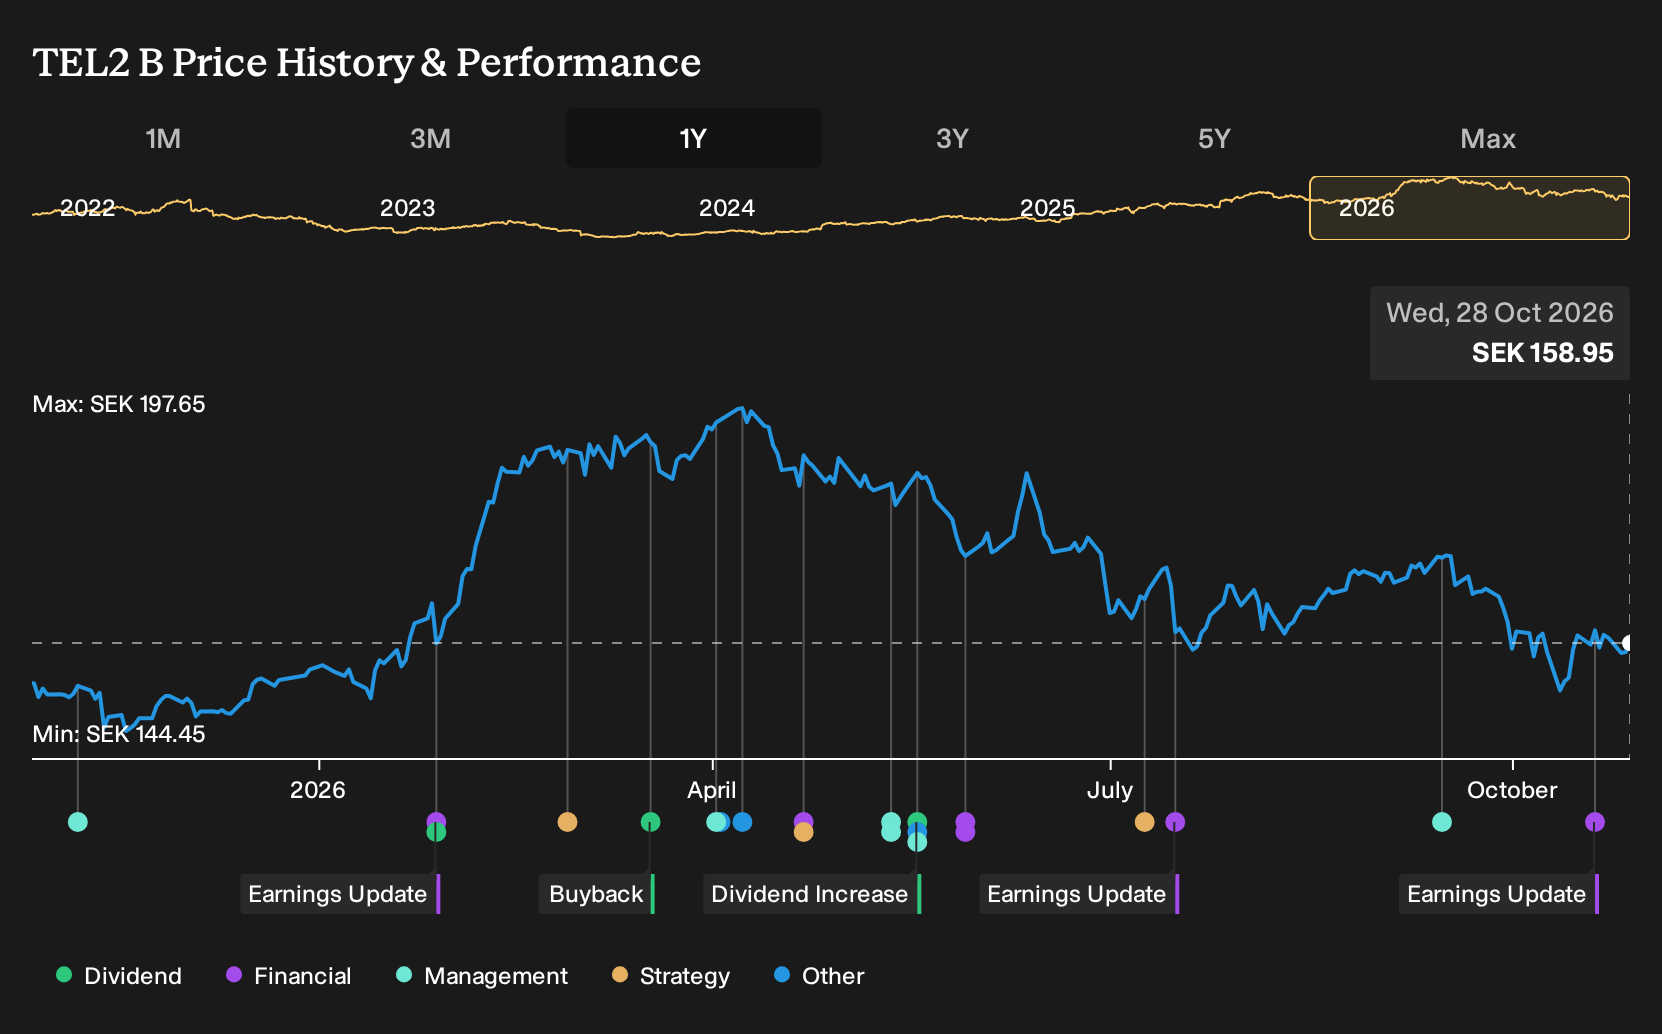
Exploring Other Perspectives
One bullish twist on Tele2 hinges on its Baltic and IoT potential rather than cost cuts. The most optimistic analysts were pencilling in SEK 32.6b of revenue and SEK 5.7b of earnings by 2029 before this earnings release. That is a far brighter story than consensus and shows how widely views can differ. Use this quarter as a chance to compare both sets of assumptions and consider which outlook aligns more closely with your own expectations.
Explore 4 other Tele2 fair value estimates, including one that suggests potential upside of as much as 61% from the current price.
Decide For Yourself
Disagree with existing narratives? Extraordinary investment outcomes rarely come from following the herd, so consider trusting your own analysis.
- A great starting point for your Tele2 research is our analysis highlighting 4 key rewards and 3 important warning signs that could impact your investment decision.
- See our latest analysis for Tele2. The report includes a comprehensive fundamental analysis summarized in a single visual, the Snowflake, making it easy to evaluate Tele2's overall financial health at a glance.
Looking For More Investment Ideas Beyond Tele2?
Tele2 might sit at the center of your research today, but the best portfolios rarely rely on a single cash generator. Use this moment to widen your watchlist and search for other businesses with balance sheet strength, dependable cash flows, or underappreciated potential.
- If capital protection ranks high on your list, start with a 231 resilient stocks with low risk scores that aims to keep volatility in check while still offering equity upside.
- For investors hunting for mispriced opportunities, cast a wider net with a 608 high quality undiscovered gems that highlight strong fundamentals the crowd might be ignoring.
- If resilience and financial flexibility matter most to you, focus on companies screened through a list of solid balance sheet and fundamentals (205 results) that can better handle bumps in the cycle.
Have feedback on this article? Concerned about the content? Get in touch with us directly. Alternatively, email editorial-team@simplywallst.com