



Freight delivery company XPO (NYSE:XPO) met Wall Street’s revenue expectations in Q3 2026, with revenue rising 12.4% year on year to $2.37 billion. Its non-GAAP profit of $1.70 per share was 8% above analysts’ consensus estimates.
For more on XPO, read our free full research report.
XPO (XPO) Q3 2026 highlights:
- Revenue $2.37 billion vs S&P analysts’ consensus estimates of $2.38 billion (12.4% year-on-year growth, in line)
- Adjusted EPS $1.70 vs S&P analysts’ consensus estimates of $1.57 (8% beat)
- Adjusted EBITDA $433 million vs analysts’ consensus estimates of $417.2 million (18.2% margin, 3.8% beat)
- Operating margin 12.1%, up from 7.8% in the same quarter last year
- Free cash flow margin 22.7%, up from 10.6% in the same quarter last year
- Market capitalization $21.27 billion
“In North American LTL, we grew adjusted operating income by 35% year-over-year and improved our adjusted operating ratio by 260 basis points, significantly outperforming seasonality. This reflects sequential improvements in both yield and revenue per shipment, excluding fuel, alongside stronger volume growth from profitable share gains. Increasingly, we’re improving revenue quality with higher-margin freight as customers value our world-class service, including a damage claims ratio below 0.2%. And on the cost side, we’re operating more efficiently by expanding the use of AI across our network.”
Revenue growth
A company’s long-term performance is an indicator of its overall quality. Any business can have short-term success, but a top-tier one grows for years. XPO’s revenue grew at a tepid 4.5% annualized rate over the last five years, falling short of the industrials sector standard.
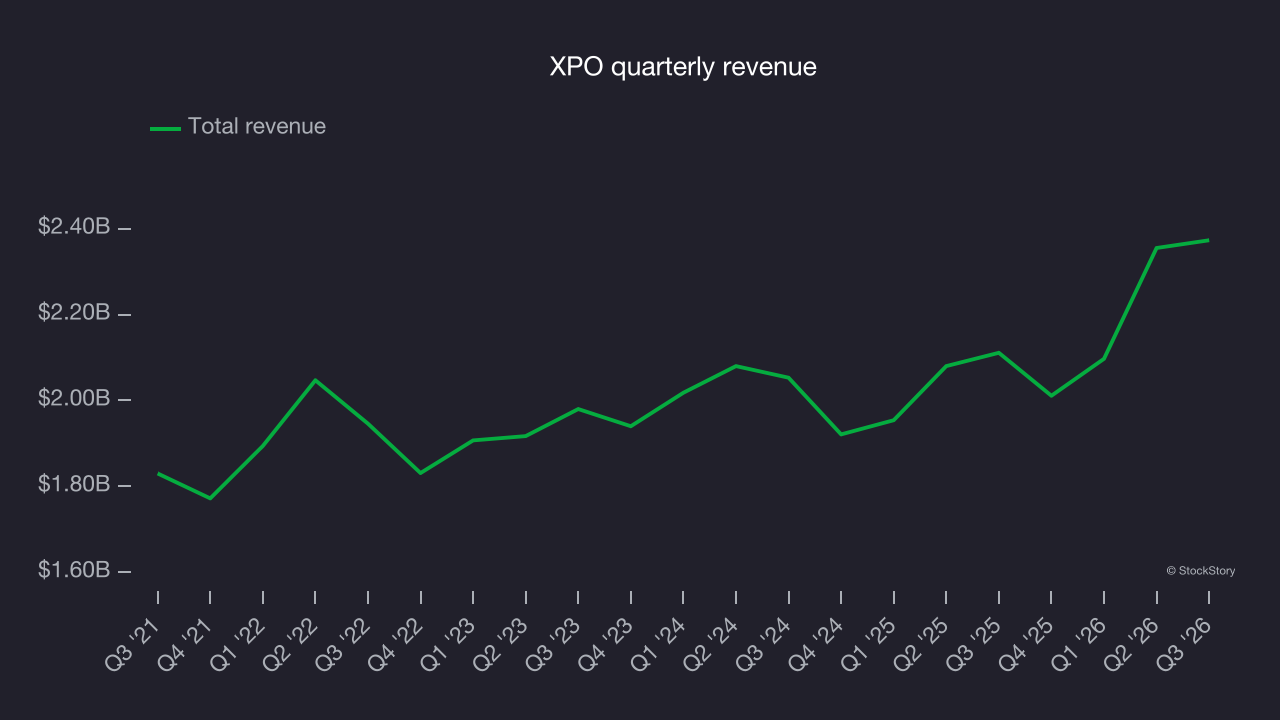
Long-term growth matters most, but within industrials, a half-decade historical view may miss cycles, industry trends or a company capitalizing on catalysts such as a new contract win or a successful product line. XPO’s annualized revenue growth of 4.5% over the last two years aligns with its five-year trend, suggesting its demand was consistently weak. 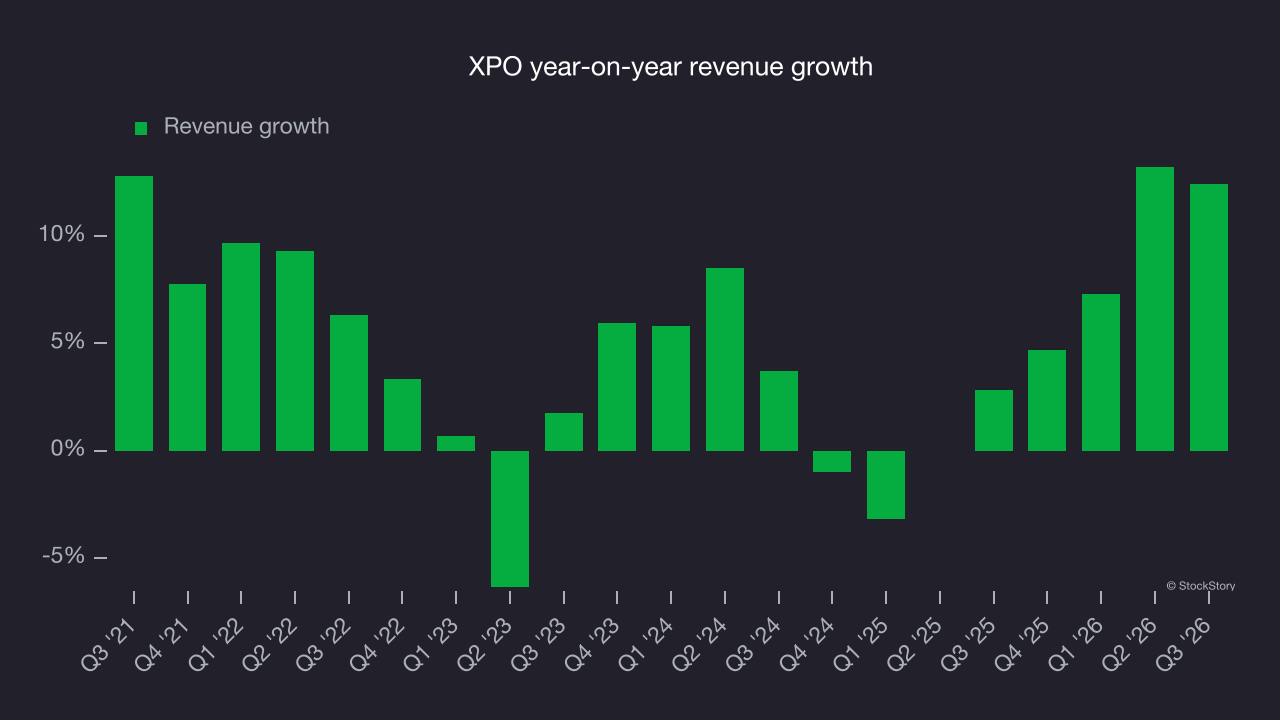
This quarter, XPO’s year-on-year revenue growth was 12.4%, and its $2.37 billion of revenue was in line with Wall Street’s consensus estimates.
Looking ahead, sell-side analysts expect revenue to grow 6.9% over the next 12 months, according to S&P. Although this projection implies its newer products and services will spur better top-line performance, it is still below the sector average.
Operating margin
XPO was profitable over the last five years but held back by its large cost base. Its average operating margin of 7.3% was weak for an industrials business. That outcome is unsurprising given its low gross margin baseline.
On the positive side, XPO’s operating margin rose by 4.2 percentage points over the last five years, as its revenue growth provided operating leverage.
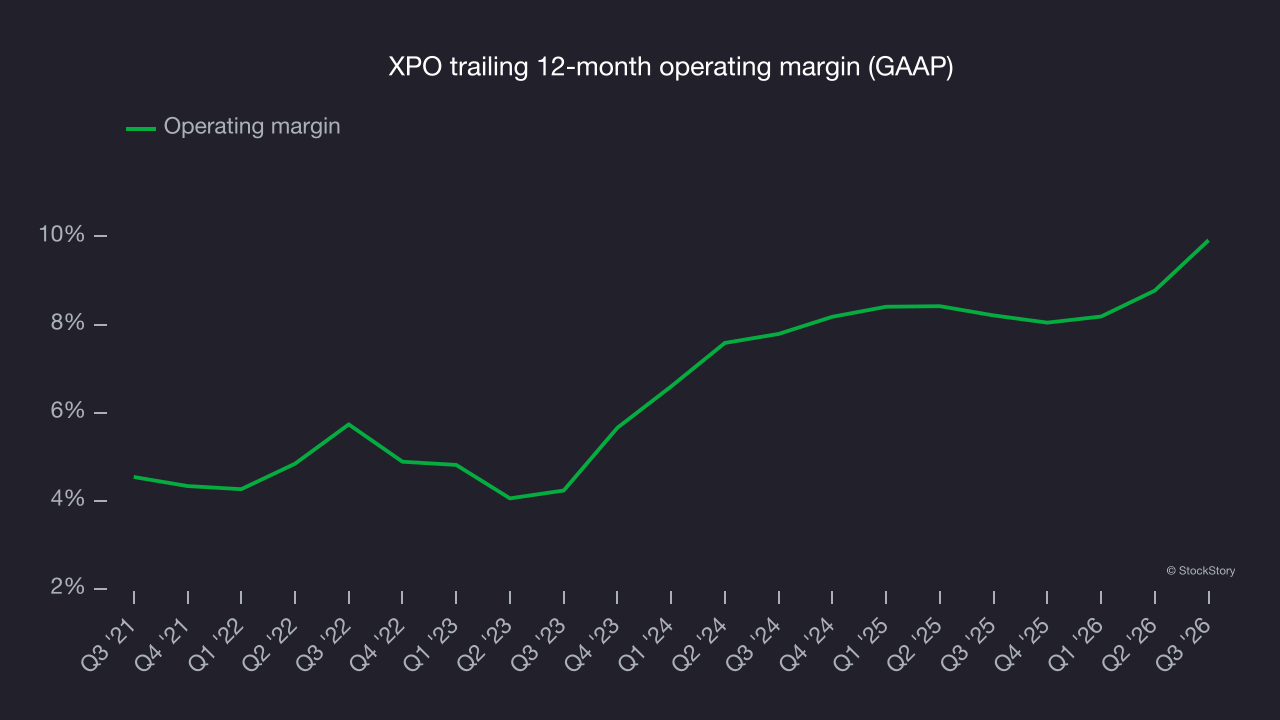
In Q3, XPO generated an operating margin of 12.1%, up 4.4 percentage points year on year. The increase was a positive sign, and operating margin rose more than gross margin, indicating greater efficiency in expenses such as marketing, R&D and administrative overhead.
Earnings per share
Revenue trends explain a company’s historical growth, but the long-term change in earnings per share (EPS) points to the profitability of that growth. For example, a company could inflate its revenue through excessive spending on advertising and promotions.
XPO’s flat EPS over the last five years was below its 4.5% annualized revenue growth. However, its operating margin improved during this time, indicating that non-fundamental factors such as interest expenses and taxes affected its ultimate earnings.
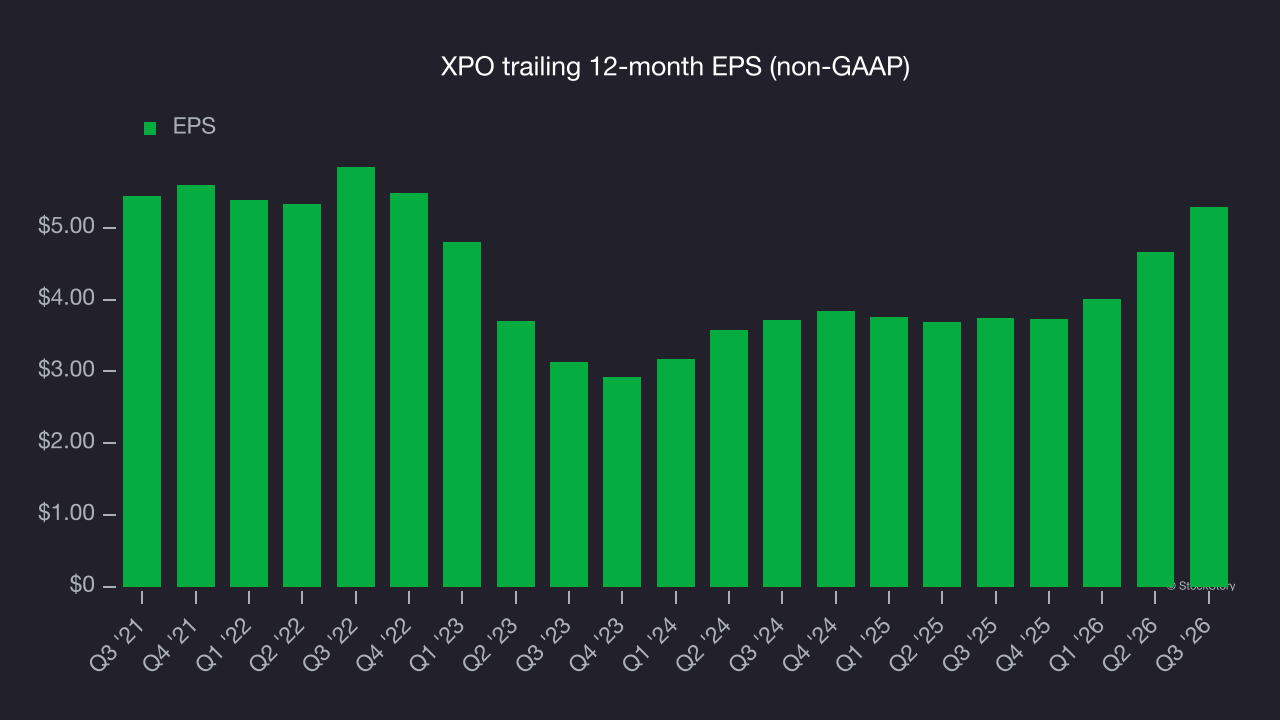
Diving into the nuances of XPO’s earnings can give us a better understanding of its performance. A five-year view shows XPO has diluted its shareholders, growing its share count by 1.7%. This dilution overshadowed its increased operational efficiency and has led to lower per share earnings. Taxes and interest expenses can also affect EPS but don’t tell us as much about a company’s fundamentals. 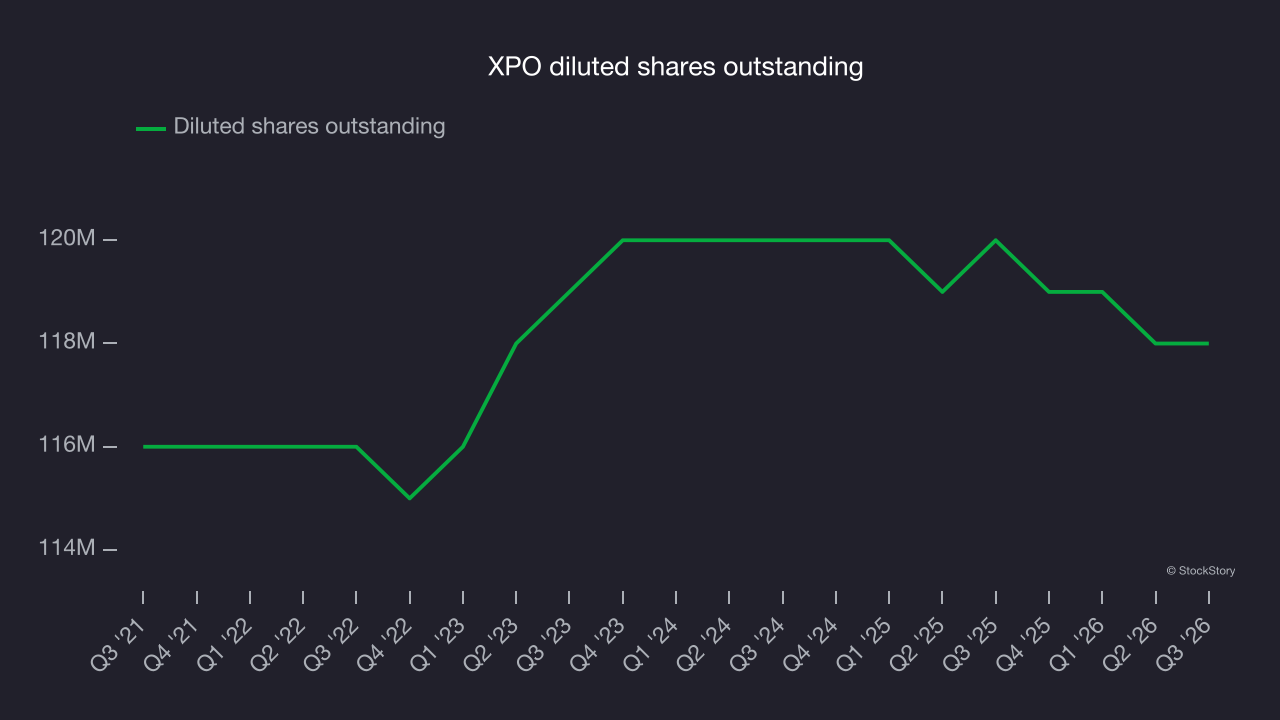
As with revenue, examining EPS over a shorter period can reveal changes in the business.
For XPO, its two-year annual EPS growth of 19.2% was higher than its five-year trend. This acceleration made it one of the faster-growing industrials companies in recent history.
In Q3, XPO reported adjusted EPS of $1.70, up from $1.07 in the same quarter last year. This result beat analysts’ consensus estimates by 8%. Over the next 12 months, Wall Street expects XPO’s full-year EPS to grow 19.3% from $5.29 to $6.31, according to S&P.
Key takeaways from XPO’s Q3 results
XPO’s quarter had some key positives, with EBITDA and EPS both topping analysts’ consensus estimates. Revenue, however, only met expectations. Investors were likely hoping for more, and shares edged lower 1.7% to $178.59 immediately after the results.
Assessing XPO as an investment means considering its valuation, business quality and latest quarterly results. For more on XPO, read our full research report here (it’s free).