



Specialty vehicles contractor Oshkosh (NYSE:OSK) fell short of the market’s revenue expectations in Q3 2026, with revenue ring 5.7% year on year to $2.84 billion vs. $2.94B prior consensus. The company’s full-year revenue guidance of $11 billion at the midpoint came in 1.3% below analysts’ consensus estimates. Its non-GAAP profit of $2.41 per share was 21.4% below analysts’ consensus estimates.
For more on Oshkosh, read the full research report for free.
Oshkosh (OSK) Q3 2026 highlights:
- Revenue $2.84 billion vs S&P analysts’ consensus estimates of $2.94 billion (5.7% year-on-year growth, 3.3% miss)
- Adjusted EPS $2.41 vs S&P analysts’ consensus estimates of $3.06 (21.4% miss)
- Revenue guidance The company lowered its revenue guidance for the full year to $11 billion at the midpoint from $11.2 billion, a 1.8% decrease
- Adjusted EPS guidance Management lowered its full-year adjusted EPS guidance to $9 at the midpoint, an 18.2% decrease
- Operating margin 6.9%, down from 9.7% in the same quarter last year
- Free cash flow margin 9.7%, down from 17.3% in the same quarter last year
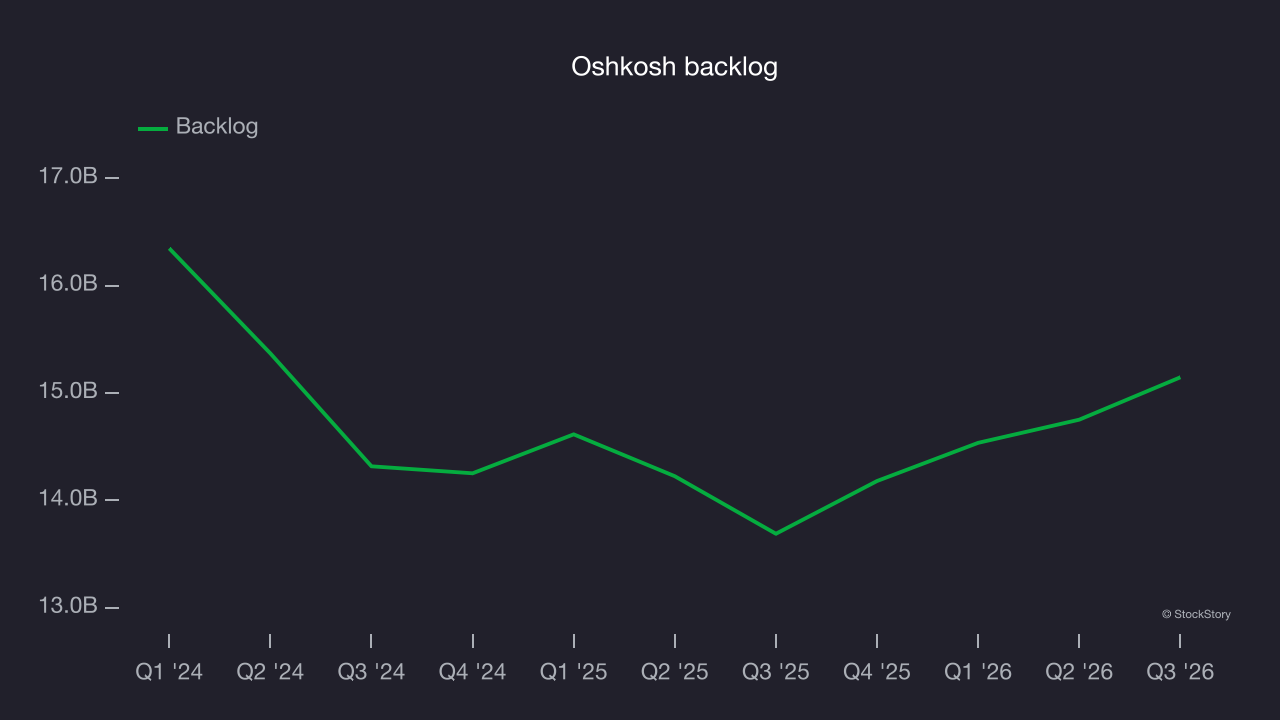
- Backlog $15.15 billion at quarter end, up 10.6% year on year
- Market capitalization $8.52 billion
“Our results reflected challenges arising from our transformation of fire truck production. Improvements in throughput are taking longer than we previously expected, and we have identified the primary factors that affected production. We are taking focused actions to improve material flow and strengthen production scheduling, and we believe this is a near-term issue. We delivered solid performance in our Access segment during the third quarter, reflecting strong customer demand and improved execution,” said John Pfeifer, president and chief executive officer of Oshkosh Corporation.
Revenue growth
Examining a company’s long-term performance can provide clues about its quality. Any business can have short-term success, but a top-tier one grows for years. Over the last five years, Oshkosh grew its revenue at a mediocre 6.8% compounded annual growth rate, falling short of the industrials sector benchmark.
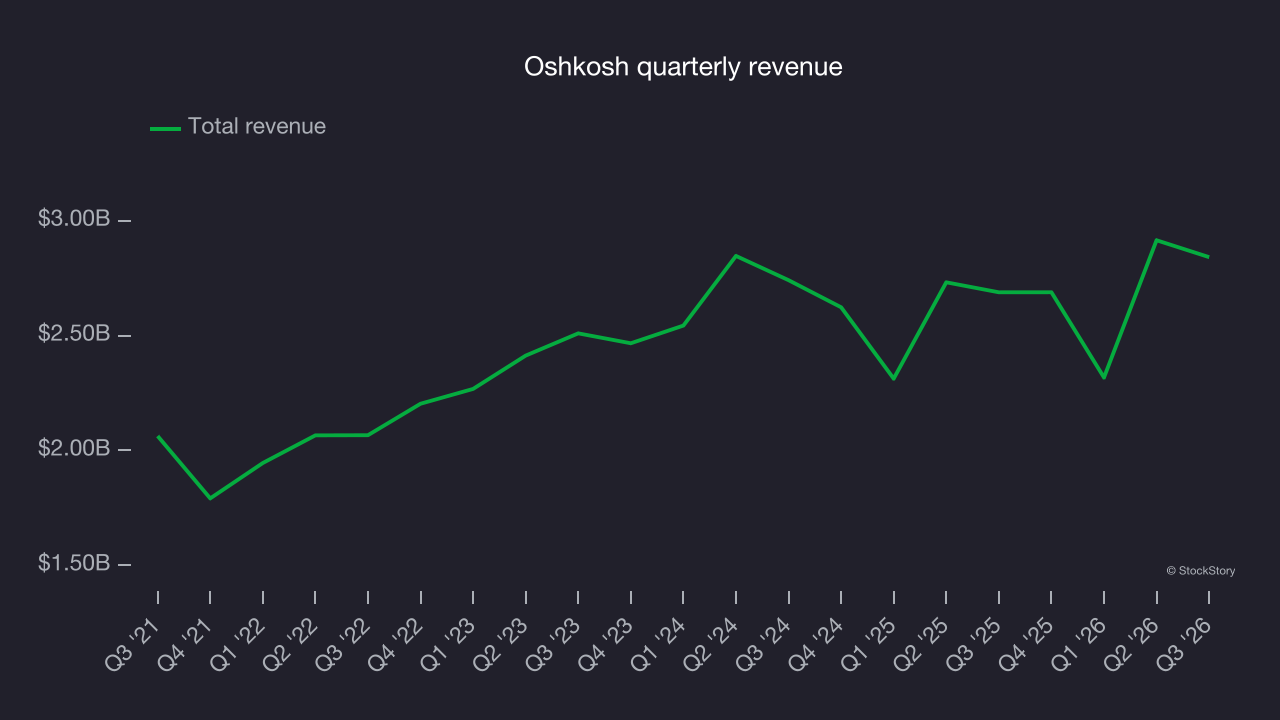
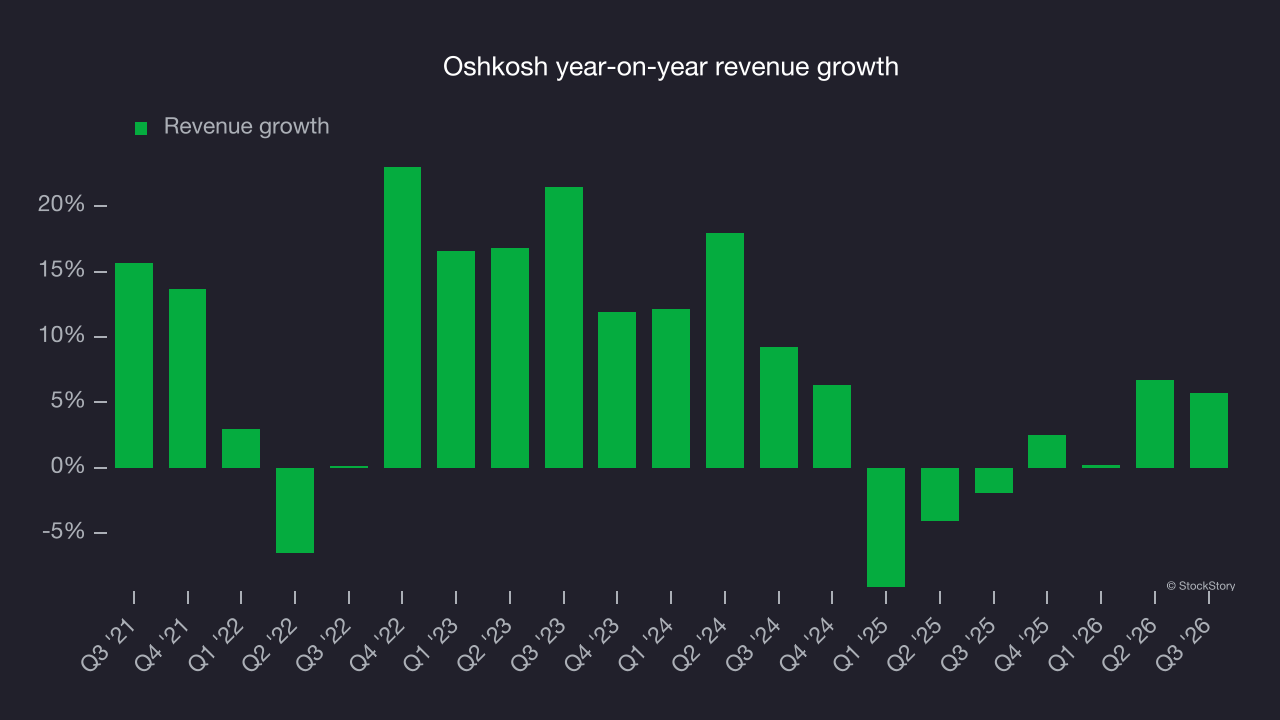
This quarter, Oshkosh’s revenue grew by 5.7% year on year to $2.84 billion, missing Wall Street’s consensus estimates.
Looking ahead, sell-side analysts expect revenue to grow 9.6% over the next 12 months, according to S&P, an improvement versus the last two years. This projection is particularly noteworthy for a company of its scale and implies its newer products and services will spur better top-line performance.
Operating margin
Oshkosh was profitable over the last five years but held back by its large cost base. Its average operating margin of 7.6% was weak for an industrials business. That outcome is unsurprising given its low gross margin baseline.
On the positive side, Oshkosh’s operating margin rose by 3.4 percentage points over the last five years, as its revenue growth provided operating leverage.
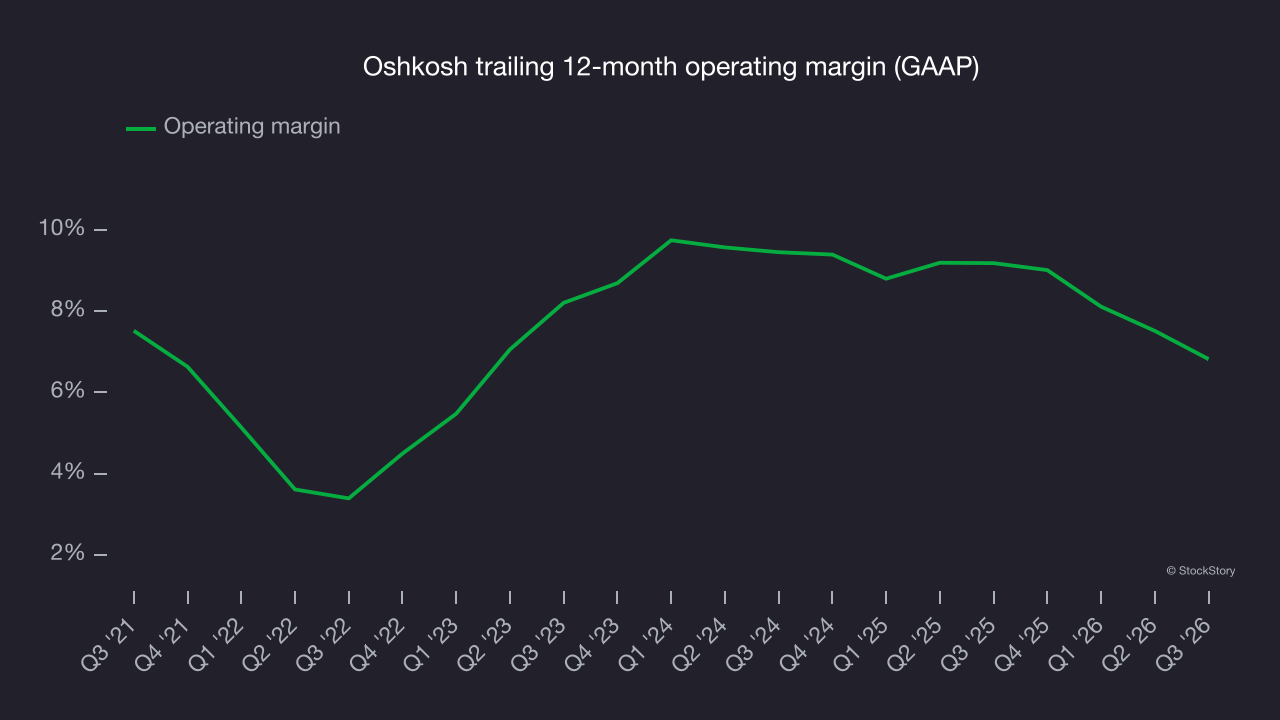
In Q3, Oshkosh generated an operating margin of 6.9%, down 2.7 percentage points year on year. Its operating margin declined more than its gross margin, suggesting lower efficiency as expenses such as marketing, R&D and administrative overhead increased.
Earnings per share
Revenue trends explain a company’s historical growth, but the long-term change in earnings per share (EPS) points to the profitability of that growth – for example, a company could inflate its revenue through excessive spending on advertising and promotions.
Oshkosh’s unimpressive 7.8% annual EPS growth over the last five years aligns with its revenue performance. On the positive side, this indicates its incremental revenue was profitable.
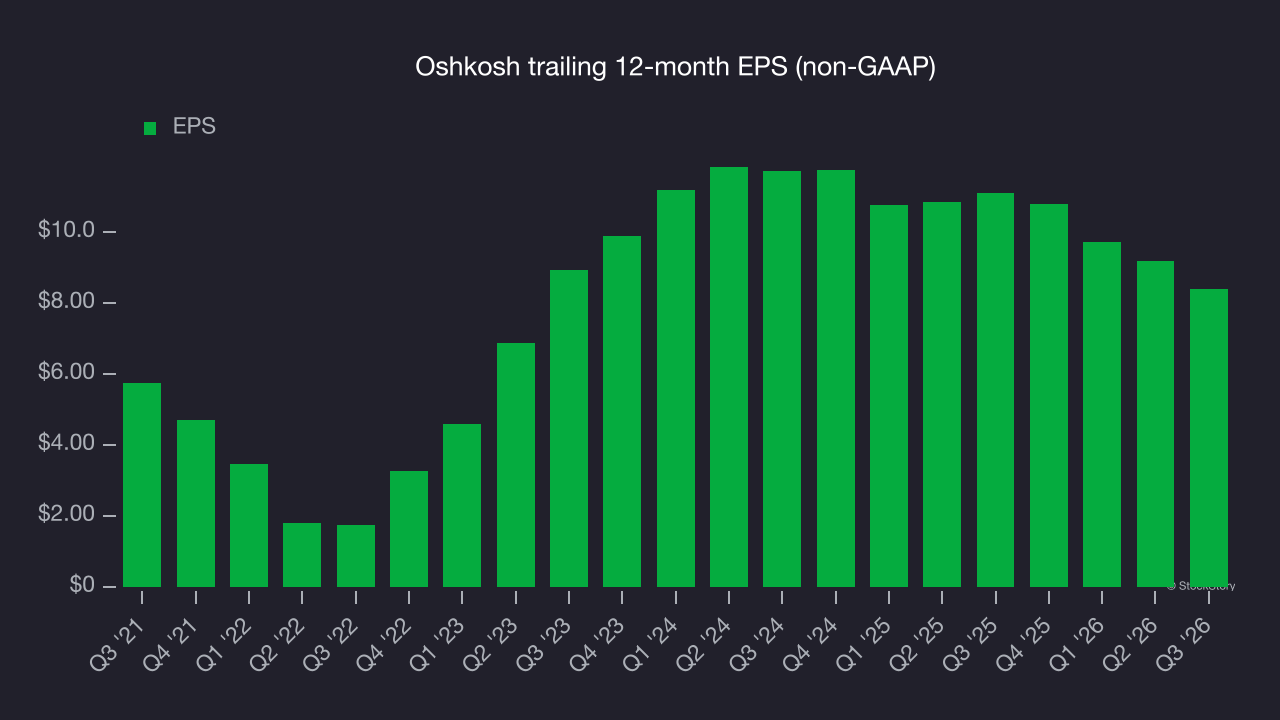
Like with revenue, we analyze EPS over a more recent period because it can provide insight into an emerging theme or development for the business.
Oshkosh’s EPS declined at an annual rate of 15.4% over the last two years, a poor result that trailed its flat revenue.
Diving into the nuances of Oshkosh’s earnings can give us a better understanding of its performance. Oshkosh’s operating margin has declined over the last two years. This was the most relevant factor (aside from the revenue impact) behind its lower earnings; interest expenses and taxes can also affect EPS but don’t tell us as much about a company’s fundamentals.
In Q3, Oshkosh reported adjusted EPS of $2.41, down from $3.20 in the same quarter last year. This result missed analysts’ consensus estimates. Over the next 12 months, Wall Street expects Oshkosh’s full-year EPS to grow 64.6% from $8.39 to $13.81, according to S&P.
Key takeaways from Oshkosh’s Q3 results
Oshkosh’s revenue fell short of Wall Street’s consensus estimates, and its full-year EPS guidance also missed expectations. It was a softer quarter with few positives. Shares plunged 13.5% to $119.30 immediately after the results.
Oshkosh may have had a tough quarter, but does that create an investment opportunity? The latest quarter matters, but not nearly as much as longer-term fundamentals and valuation when deciding whether to buy. For more on Oshkosh, read our full research report here (it’s free).