


Capcom came into this Q2 2027 report with a premium story. The share price had already slipped about 14% over the past month, while the stock still traded on a higher P/E than the broader Japanese entertainment group.
Given that stretched reputation, the latest quarter was all about profit pressure. Net income landed at ¥13,924m on revenue of ¥50,477m, indicating a squeeze compared with recent earnings power. The immediate question for investors now is whether that margin strain is a temporary issue in the hit pipeline or a sign that the thesis needs a reset.
If you like Capcom’s hit driven earnings but feel uneasy about the recent margin squeeze and premium P/E, consider filtering for businesses that pair resilient profitability with sturdier balance sheets using the list of solid balance sheet and fundamentals stocks (23 results).
Q2 2027 Earnings Summary
- Revenue (Q2 2027 vs. Q2 2026): ¥50,477m vs. ¥35,650m (up about 41.6%)
- Net Income (Excl. Extra Items, Q2 2027 vs. Q2 2026): ¥13,924m vs. ¥10,276m (up about 35.5%)
- Basic EPS (Q2 2027 vs. Q2 2026): ¥33.28 vs. ¥24.57 (up about 35.4%)
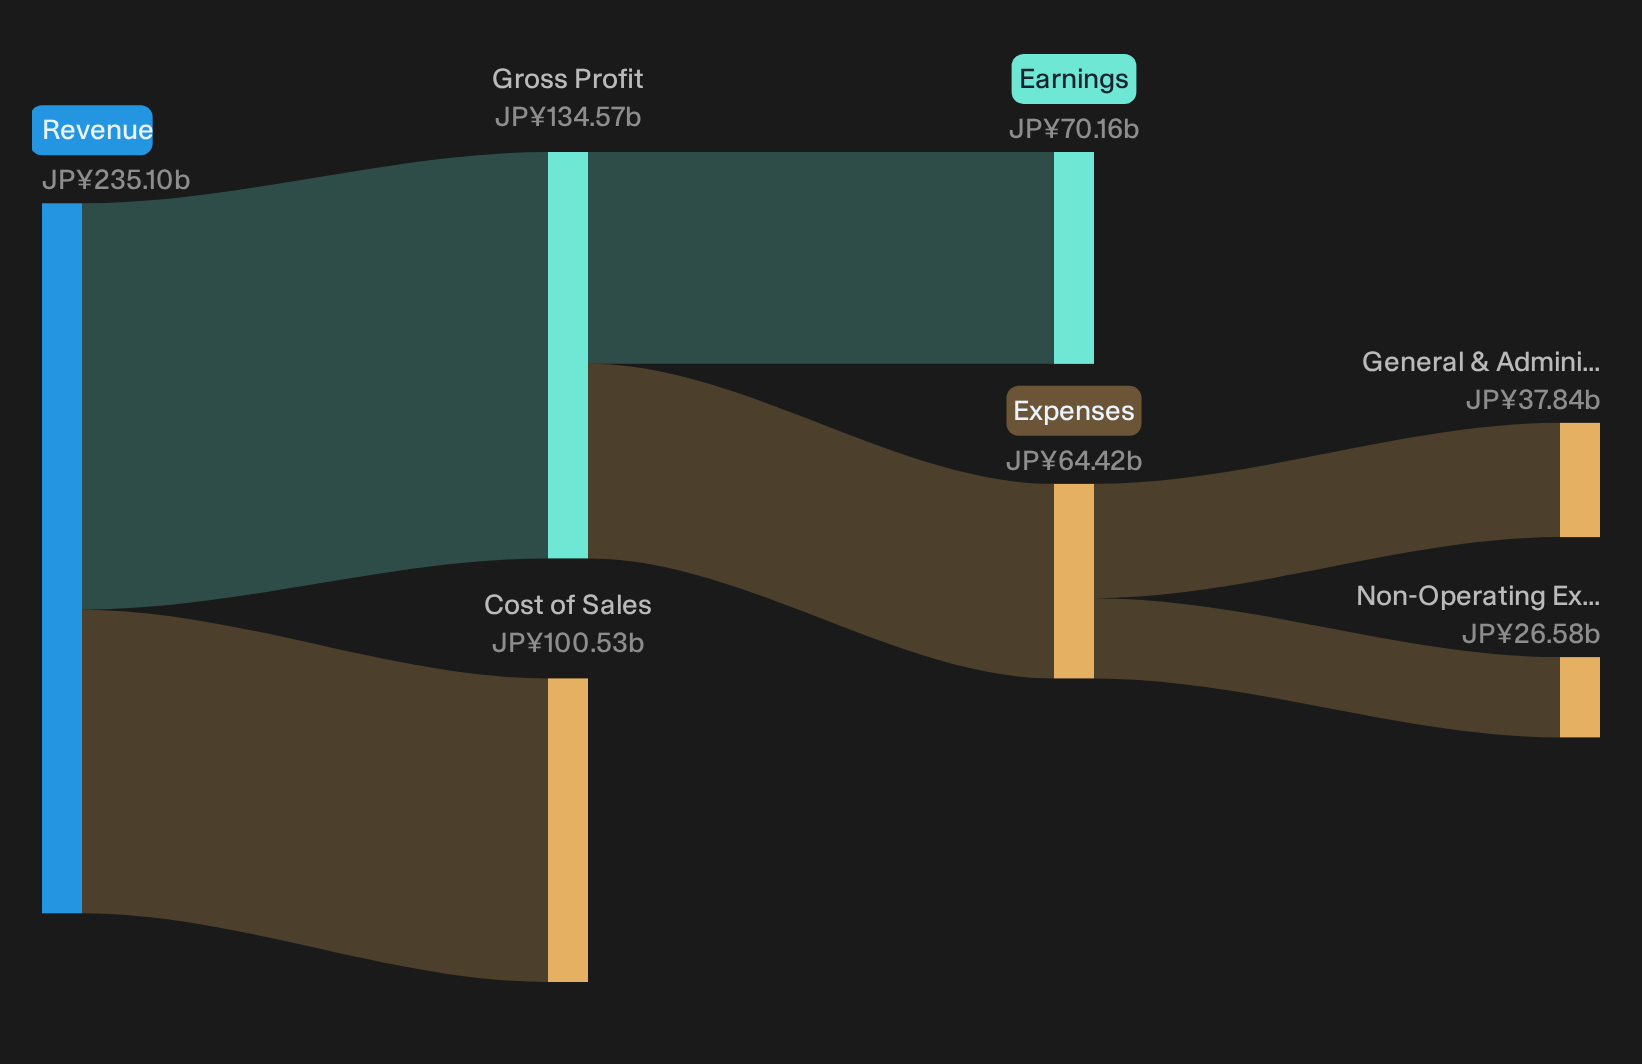
- Trailing 12 Month Net Income (Excl. Extra Items, Q2 2027 vs. Q2 2026): ¥70,156m vs. ¥60,692m (up about 15.6%)
Earnings tell you what Capcom reported this quarter, while cash flows tell you what the business is actually funding and returning over time. Based on those cash flows alone, Capcom's TSE:9697 profile suggests the stock could be a narrow 13% overvalued.
Capcom bull case: RE Engine efficiency under pressure
The bullish story says Capcom’s proprietary tools keep content flowing efficiently, so profitability should hold up even as the slate expands.
"Every title that ships on the RE Engine feeds improvements back into it. Capcom's developers have described it as a collective intelligence that grows with each project."
Q2 revenue of ¥50,477m and net income of ¥13,924m show the content machine is still generating volume, yet margins compressed compared with recent earnings power. The RE Engine efficiency loop is intact on output, but this quarter tests the claim that those tools alone are enough to defend profitability.
Capcom bear case: franchise dependence meets margin strain
The bear story focuses on concentration in a few series and the risk that one weak beat can dent profitability.
"Concentration risk: Resident Evil, Monster Hunter, and Street Fighter account for the vast majority of revenue. A major creative miss on any flagship could impact sentiment disproportionately."
Recent launches such as Onimusha and pipeline titles have kept revenue at ¥50,477m in Q2, while trailing 12‑month net income reached ¥70,156m. The concern now is not an obvious flagship flop but earnings quality. The latest quarter’s margin squeeze means the risk has shifted from demand for key franchises to the cost and mix required to sustain them.
Not everyone reads the same price the same way. → See the higher figure this Narrative lands on, and how it gets there.
Explore Potential Disconnects Quietly
Capcom’s latest quarter highlights how investors compare share prices with reported earnings. The real opportunity could be spotting stocks that could be undervalued before expectations and pricing line up.
- Company 1 - 43% below our estimate - runs deposit taking and lending and expands into fee based services like leasing and credit cards.
- Company 2 - 32% below our estimate - builds payments rails connecting cards, banks, carriers and wallets as merchants shift to recurring and online billing.
- Company 3 - 30% below our estimate - supplies advanced photomasks and molds that chip designers adopt when moving into finer geometries and new packaging formats.
That is three of the list. See every one of the 15 undervalued companies on it →
Have feedback on this article? Concerned about the content? Get in touch with us directly. Alternatively, email editorial-team@simplywallst.com