


Recent debate around Toho Bank (TSE:8346) is being driven by one question: Does a roughly 17x P/E and premium valuation still line up with the bank’s earnings power and balance sheet quality?
Despite valuation questions, Toho Bank’s share price has surged over the year, with a year to date share price return of 79.93% and a 1 year total shareholder return of 123.52%. This builds on a very large 5 year total shareholder return, even though the 30 day share price return of 10.36% shows some cooling in the near term.
Compare Toho Bank’s premium P/E and balance sheet story with a curated list of solid balance sheet and fundamentals (23 results) to see how other financials line up on quality and valuation risk.
Bulls point to Toho Bank’s strong multi year shareholder returns and solid looking balance sheet, while bears focus on that premium 17x P/E after such a sharp rerating. Which side does the current valuation really support?
Price-to-Earnings of 17.4x: Is it justified?
At a last close of ¥986, Toho Bank trades on a P/E of 17.4x. This screens as expensive relative to both the Japan banks sector and its closest peers.
P/E compares the current share price with earnings per share and gives a quick sense of how much investors are willing to pay for each unit of profit. For a regional lender like Toho Bank, that figure often reflects expectations around earnings resilience, interest margin, and credit costs, rather than high growth hopes.
The business has characteristics that can support investor confidence, including high quality earnings and profit growth over the past year that outpaced the wider banks industry. At the same time, Return on Equity of 6.3% is classified as low, the allowance for bad loans is described as low at 44%, and the dividend track record is unstable. These factors can all make a premium multiple harder to rationalise if conditions change.
The premium is clear. The 17.4x P/E is described as expensive versus the Japan banks industry average of 14.1x and also costly compared with a 14.3x peer average. That signals the market is paying a clear mark up for Toho Bank compared to similar financial institutions, and that any disappointment on profitability or asset quality could matter more than for cheaper peers.
See what the numbers say about this price — find out in our valuation breakdown.
Result: Price-to-Earnings of 17.4x (OVERVALUED).
Still, Toho Bank’s low 6.3% Return on Equity and limited allowance for bad loans at 44% leave little room for earnings or credit surprises.
Find out about the key risks to this Toho Bank narrative.
Another View on Toho Bank’s Valuation
A different lens comes from the SWS DCF model. On this approach, Toho Bank at ¥986 is described as trading above an estimated future cash flow value of ¥360.7, which screens as overvalued. That is a wide gap. Does the P/E premium really justify paying almost three times that implied figure?
Look into how the SWS DCF model arrives at its fair value.
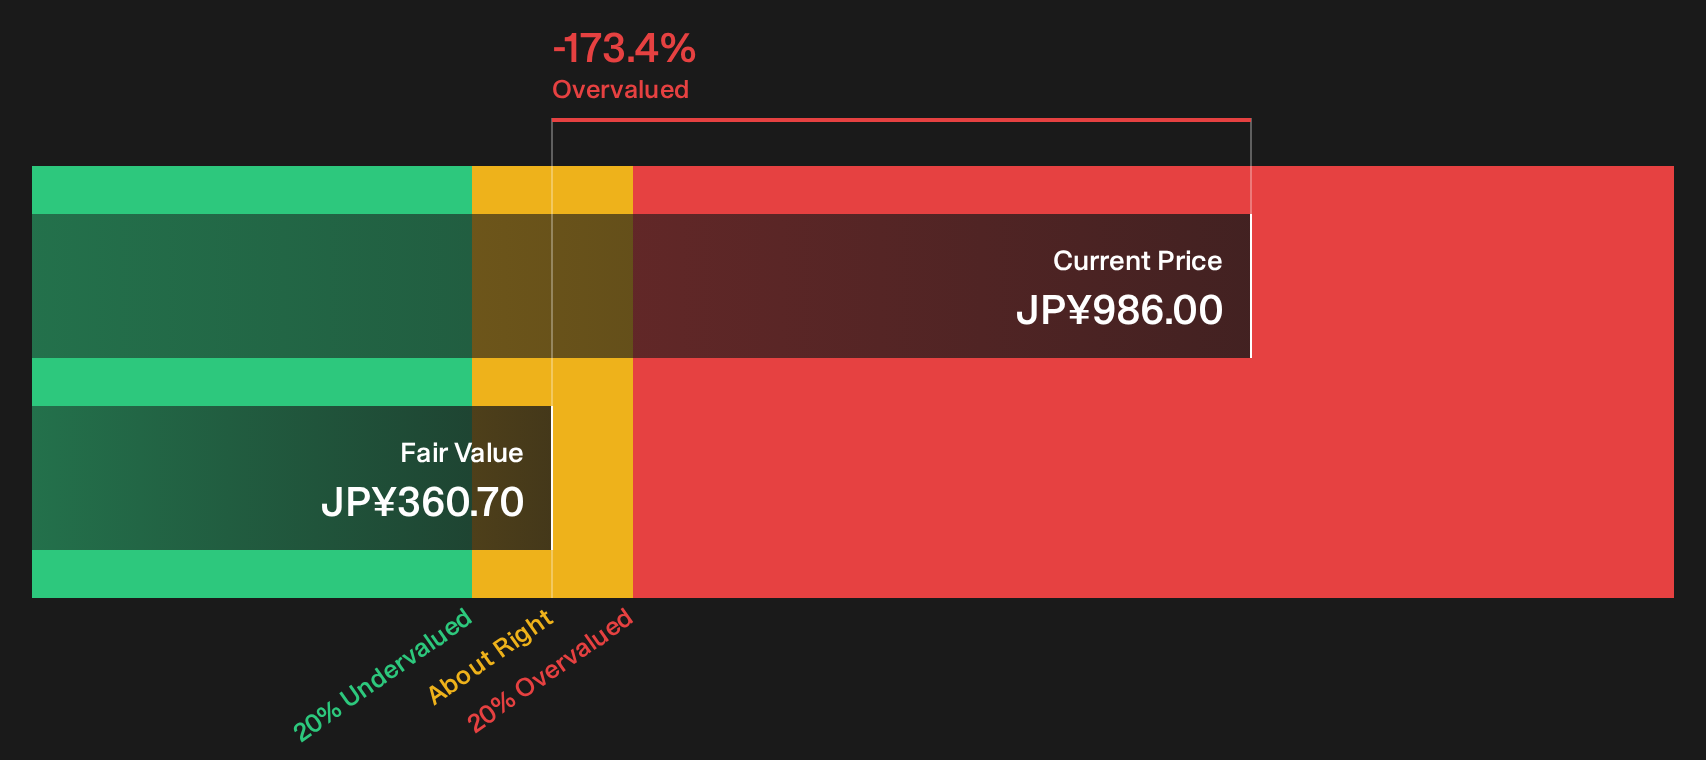
Simply Wall St performs a discounted cash flow (DCF) on every stock in the world every day (check out Toho Bank for example). We show the entire calculation in full. You can track the result in your watchlist or portfolio and be alerted when this changes, or use our stock screener to discover 15 high quality undervalued stocks. If you save a screener we even alert you when new companies match - so you never miss a potential opportunity.
Next Steps
Mixed signals around Toho Bank’s premium multiple and risk profile will mean different things to different investors, so move quickly, review the key data points, and weigh both the positives and the pressure points for yourself with the 1 key reward and 3 important warning signs
Looking for more investment ideas beyond Toho Bank?
If Toho Bank has sharpened your focus on valuation and risk, broaden your watchlist now with a few targeted stock ideas built from clear fundamentals.
- Target resilient balance sheets and steadier cash flows by scanning a curated 26 resilient stocks with low risk scores that screens for companies with lower overall risk profiles.
- Hunt for potential value opportunities by checking a focused 15 high quality undervalued stocks that filters for stronger fundamentals at comparatively cheaper valuations.
- Build a cash flow focused watchlist by reviewing a curated 30 dividend fortresses that highlights higher yielding businesses with income front and center.
Have feedback on this article? Concerned about the content? Get in touch with us directly. Alternatively, email editorial-team@simplywallst.com