



Investment management firm Federated Hermes (NYSE:FHI) reported revenue ahead of Wall Street’s expectations in Q3 2026, with revenue up 8.1% year on year to $507.3 million. Its GAAP profit of $1.50 per share was 3.9% above analysts’ consensus estimates.
For more on Federated Hermes, read our free full research report.
Federated Hermes (FHI) Q3 2026 highlights:
- Assets under management $884.4 billion vs analysts’ consensus estimates of $900.9 billion (1.5% year-on-year growth, 1.8% miss)
- Revenue $507.3 million vs S&P analysts’ consensus estimates of $503.3 million (8.1% year-on-year growth, 0.8% beat)
- Pre-tax profit $152.1 million (30% margin)
- EPS (GAAP) $1.50 vs analysts’ consensus estimates of $1.44 (3.9% beat)
- Market capitalization $4.04 billion
"Federated Hermes generated positive net equity sales in the third quarter of 2026, including across our MDT suite of quantitative investment solutions. Assets in MDT institutional separate accounts and MDT subadvised accounts, as well as total equity assets, reached record highs," said J. Christopher Donahue, president and chief executive officer. "We also continued to see demand for our alternative strategies, including our MDT Market Neutral offerings, with alternative/private markets fund assets reaching record highs."
Revenue growth
A company’s long-term revenue performance is one signal of its overall quality. Any business can deliver a good quarter or two, but the best consistently grow over the long term. Federated Hermes’s 8% annualized revenue growth over the last five years was decent. Its growth was slightly above that of the average financials company and shows its offerings resonate with customers.
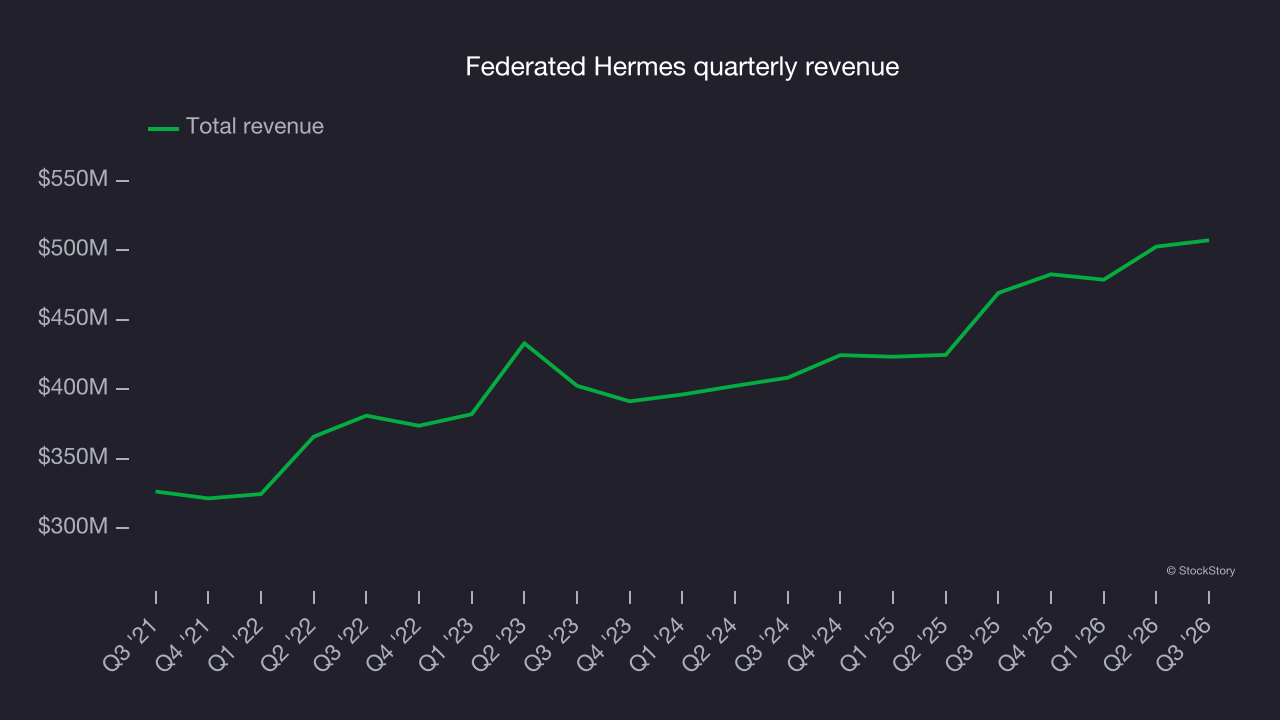
Long-term growth is the most important, but within financials, a half-decade historical view may miss recent interest rate changes and market returns. Federated Hermes’s annualized revenue growth of 11.1% over the last two years is above its five-year trend, suggesting its demand recently accelerated. 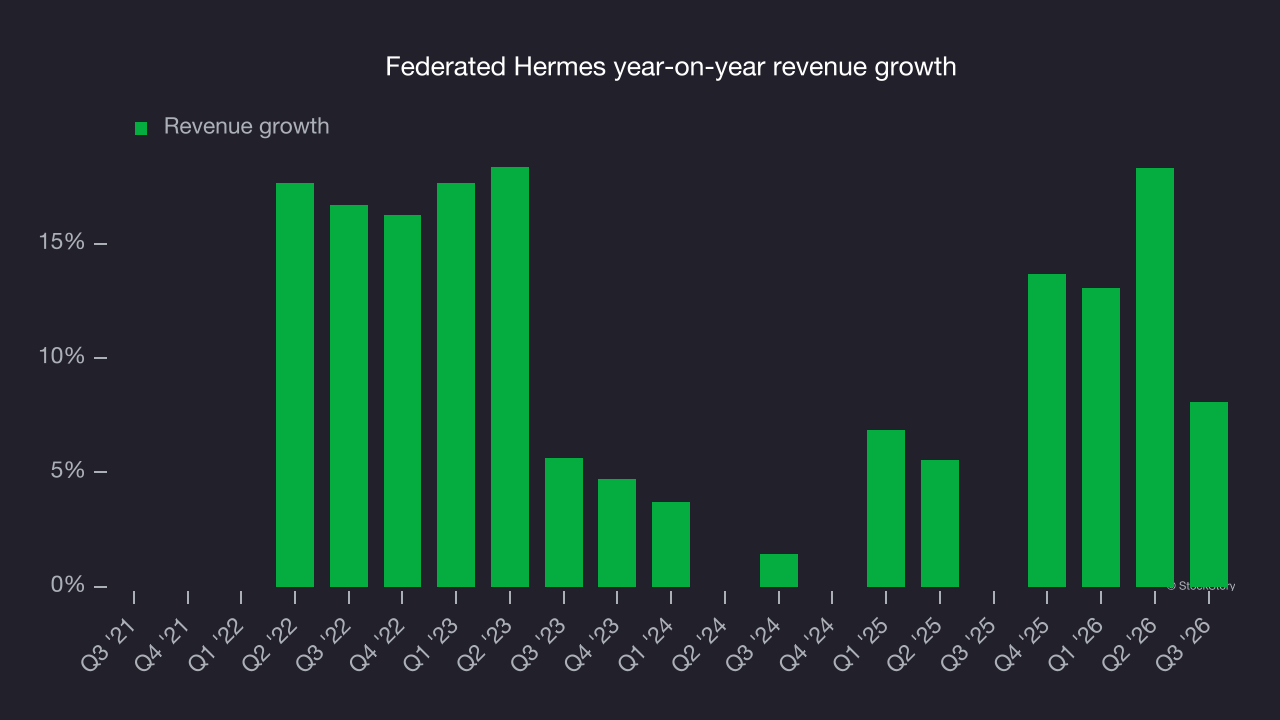 Note: Quarters not shown were determined to be outliers because they were impacted by outsized investment gains/losses that are not indicative of the recurring fundamentals of the business.
This quarter, Federated Hermes reported year-on-year revenue growth of 8.1%, and its $507.3 million of revenue exceeded Wall Street’s consensus estimates by 0.8%.
Assets under management (AUM)
Assets Under Management (AUM) represents the total value of investments that a financial institution manages for its clients. These assets generate steady income through management fees, creating predictable revenue streams that remain stable so long as clients remain invested with the firm.
Federated Hermes’s AUM has grown at an annual rate of 7.4% over the last five years, slightly worse than the broader financials industry and slower than its total revenue. Its 7.5% annual AUM growth over the last two years tells a similar story. Fundraising or short-term investment performance was a net detractor to the company over this shorter period since assets grew more slowly than total revenue. That said, assets aren’t the only consideration given their unpredictable and cyclical nature.
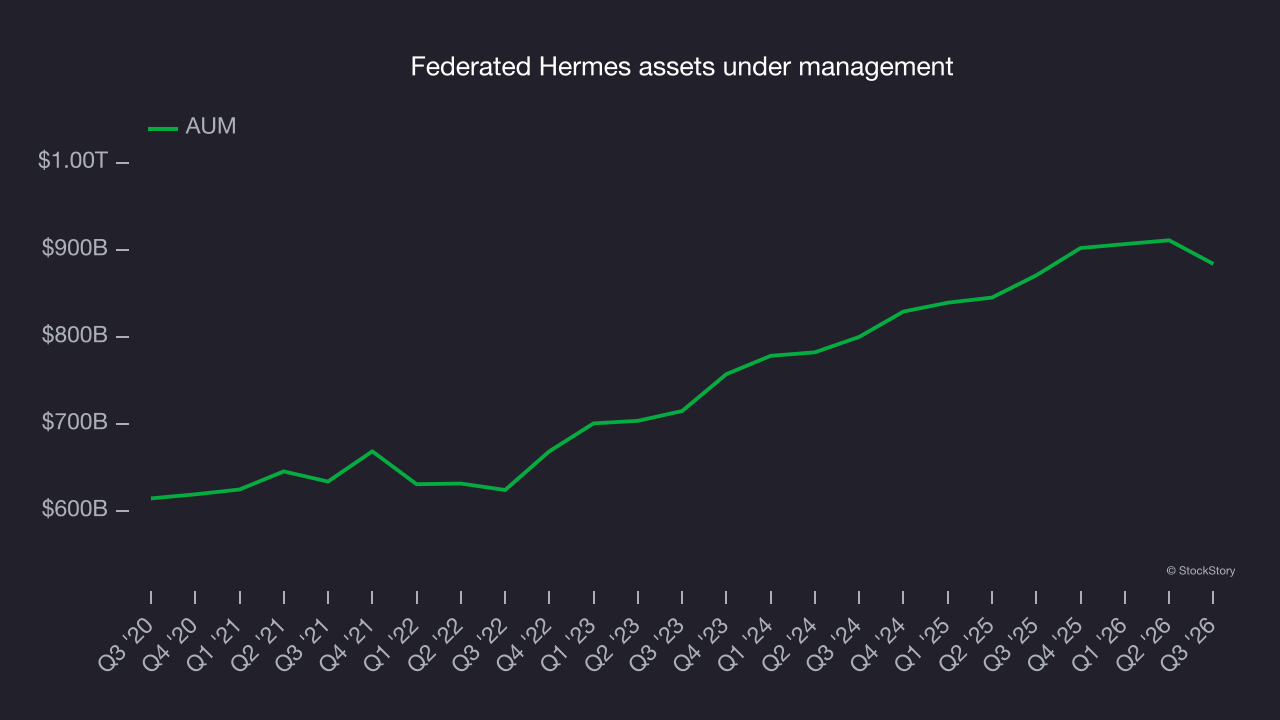
Federated Hermes’s AUM totaled $884.4 billion this quarter, falling 1.8% short of analysts’ consensus estimates. AUM rose 1.5% from the same quarter last year.
Key takeaways from Federated Hermes’s Q3 results
An EPS beat and revenue slightly above Wall Street’s consensus gave Federated Hermes’s quarter some key positives, but AUM fell short of expectations. Shares remained flat at $58.11 immediately after the release.
For investors considering Federated Hermes, the latest quarter matters, but not nearly as much as longer-term fundamentals and valuation when deciding whether the stock is a buy. Read the full research report here (it’s free).