


First National of Nebraska (FINN) just posted its third quarter update, reporting net interest income of US$533 million and net income of US$175 million, drawing fresh attention to the thinly traded stock.
At a last close of US$19,000, First National of Nebraska’s share price has logged a 22.6% year to date share price return, while the 1 year total shareholder return of 39.2% suggests momentum has been building as investors react to the latest earnings update and reassess the bank’s risk and income profile.
Scan how First National of Nebraska compares with other banks that pair earnings traction with balance sheet discipline using our hand-picked list of solid balance sheet and fundamentals (23 results)
Bulls point to First National of Nebraska’s rising earnings and long record as a regional institution, while bears focus on liquidity, size and valuation risk after a sharp run. Which side does the current pricing really support?
Preferred Price-to-Earnings of 9.7x: Is it justified?
Valuation on First National of Nebraska right now hinges on earnings. At a last close of $19,000, the stock trades at a P/E of 9.7x, which screens below both the wider US market and the US banks peer set.
The P/E ratio compares the current share price with per share earnings. For a lender like First National of Nebraska, that means you are effectively paying 9.7 times its recent earnings to own the equity. That level often reflects how confident investors feel about the durability of those profits and the risks on the balance sheet.
FINN has earned some support here. According to the checks, its 9.7x P/E sits beneath the broader US market on 18.1x and also below the US Banks industry and peer averages, both at 11.5x. The SWS DCF model, by contrast, arrives at a future cash flow value of $8,970.75 per share, which is well under the current $19,000 price. This points to a stock that screens as expensive on that cash flow lens even though the earnings multiple looks modest compared to sector benchmarks.
See what the numbers say about this price — find out in our valuation breakdown.
Result: Price-to-Earnings of 9.7x (ABOUT RIGHT)
Still, thin trading on the OTCPK market and a DCF value that trails the US$19,000 share price leave First National of Nebraska exposed if sentiment cools.
Find out about the key risks to this First National of Nebraska narrative.
Another View: Cash Flows Push Back On The P/E Story
The earnings multiple presents First National of Nebraska as cheaper than many US banks. The SWS DCF model provides a different perspective. It points to a future cash flow value of $8,970.75 per share, well below the $19,000 price, which implies the stock screens as overvalued on that lens. Which signal do you consider more reliable when the two do not match up?
Look into how the SWS DCF model arrives at its fair value.
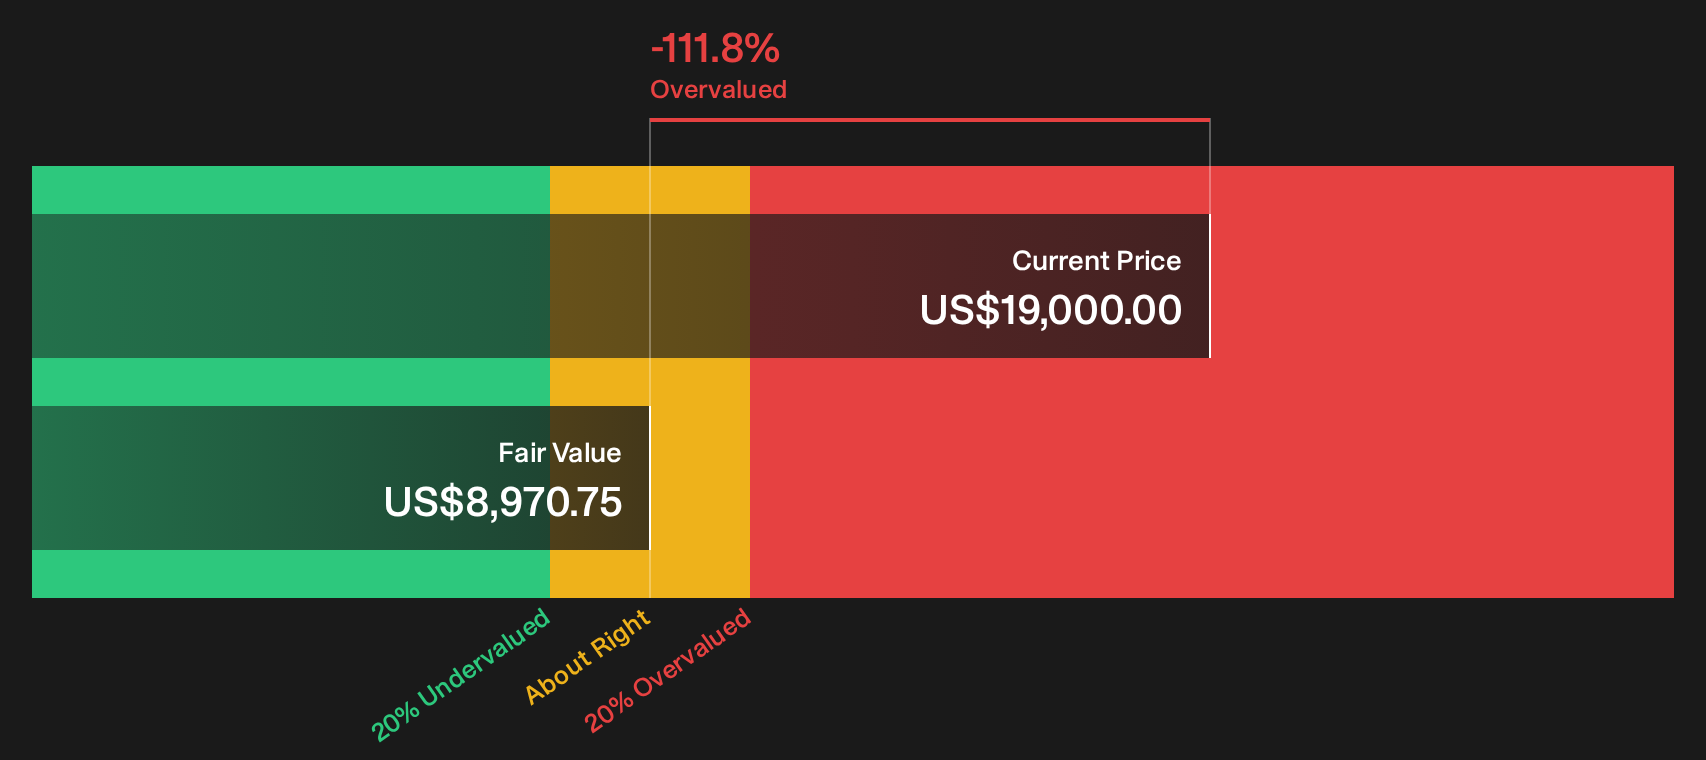
Simply Wall St performs a discounted cash flow (DCF) on every stock in the world every day (check out First National of Nebraska for example). We show the entire calculation in full. You can track the result in your watchlist or portfolio and be alerted when this changes, or use our stock screener to discover 28 high quality undervalued stocks. If you save a screener we even alert you when new companies match - so you never miss a potential opportunity.
Next Steps
With sentiment clearly split on First National of Nebraska, it helps to move fast and test the numbers against your own risk tolerance and return goals, then weigh both sides using our breakdown of 2 key rewards and 2 important warning signs
Looking for more First National of Nebraska investment ideas?
If you stop at just one bank like First National of Nebraska, you risk missing opportunities where quality, value and resilience line up more cleanly.
- Target steady compounding by scanning a curated 6 dividend fortresses that focus on income strength alongside balance sheet support.
- Hunt for mispriced potential with a focused 18 high quality undiscovered gems that filters for quality fundamentals hiding outside the usual watchlists.
- Prioritise sleep-at-night resilience by checking a 31 resilient stocks with low risk scores that screens for sturdier financial profiles when conditions get tougher.
Have feedback on this article? Concerned about the content? Get in touch with us directly. Alternatively, email editorial-team@simplywallst.com