


In October 2026, the Asian markets are experiencing a dynamic shift as small-cap stocks gain traction amid global volatility driven by AI investment concerns and rising oil prices. With the Russell 2000 Index leading major benchmarks, advancing by 2%, investors are increasingly looking towards smaller companies that can offer unique opportunities in a changing economic landscape. In this environment, identifying stocks with strong fundamentals and growth potential becomes crucial for those seeking to explore undiscovered gems within Asia's diverse market landscape.
Top 10 Undiscovered Gems With Strong Fundamentals In Asia
| Name | Debt To Equity | Revenue Growth | Earnings Growth | Health Rating |
|---|---|---|---|---|
| Chongqing Machinery & Electric | 18.92% | 8.43% | 26.16% | ★★★★★★ |
| Xinxing Ductile Iron Pipes | 30.79% | -8.44% | -29.45% | ★★★★★★ |
| Shengda ResourcesLtd | 44.63% | 9.29% | 15.82% | ★★★★★☆ |
| Shandong Head GroupLtd | 48.27% | 6.77% | -13.52% | ★★★★★☆ |
| Xiamen King Long Motor Group | 93.39% | 11.34% | 66.65% | ★★★★★☆ |
| Forth Smart Service | 44.85% | -3.80% | 10.19% | ★★★★★☆ |
| Infore Environment Technology Group | 28.47% | 4.58% | -7.19% | ★★★★★☆ |
| Sing Investments & Finance | 0.10% | 5.85% | 7.00% | ★★★★☆☆ |
| Primo Global Holdings | 64.63% | 9.93% | 28.27% | ★★★☆☆☆ |
| HANA Micron | 137.37% | 21.15% | 26.62% | ★★★☆☆☆ |
Underneath we present a selection of stocks filtered out by our screen.
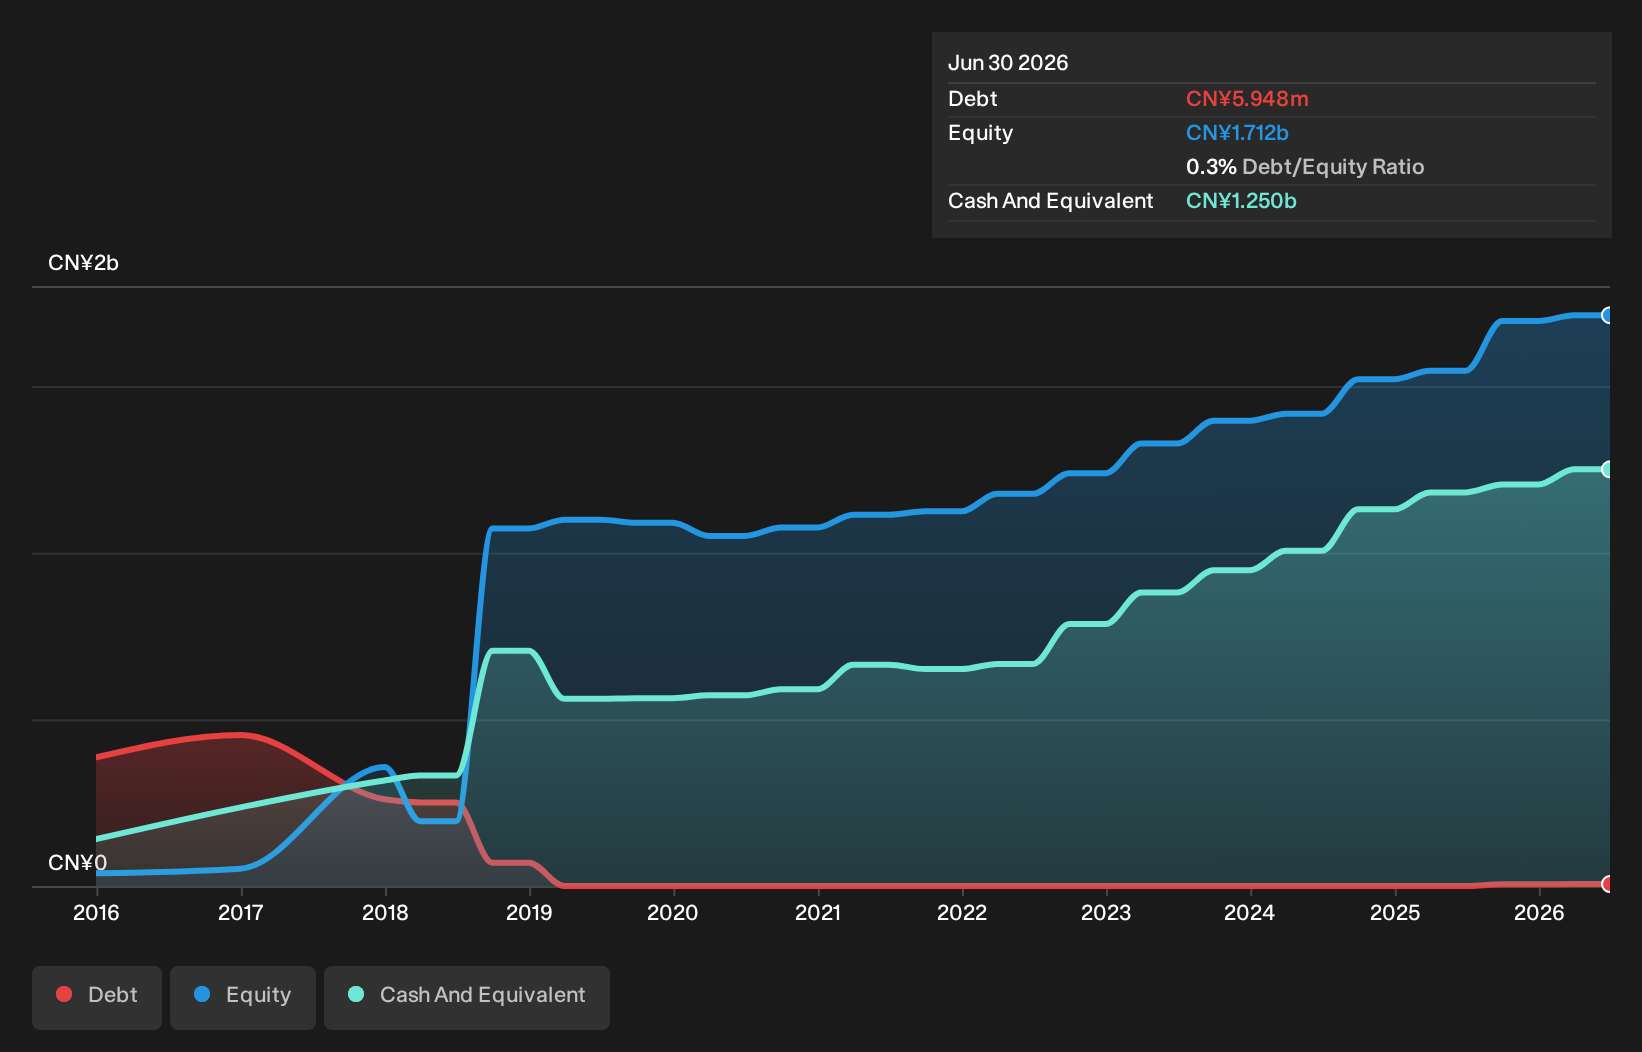
Natural Food International Holding (SEHK:1837)
Simply Wall St Value Rating: ★★★★★☆
Overview: Natural Food International Holding Limited is an investment holding company that manufactures and sells natural health food products in China, with a market capitalization of HK$2.98 billion.
Operations: The company generates revenue primarily from the processing and selling of natural health products, amounting to CN¥2.84 billion.
Natural Food International is making waves with its recent inclusion in the S&P Global BMI Index, signaling a strong market presence. The company reported impressive earnings growth for the first half of 2026, with sales reaching CNY 1.45 billion and net income climbing to CNY 155.9 million from CNY 106.77 million last year. Earnings per share rose to CNY 0.072 from CNY 0.049, reflecting robust performance in a competitive industry environment. With high-quality earnings and trading at an attractive valuation compared to peers, it seems poised for continued growth as it outpaces industry averages significantly in earnings expansion.
Transcend Information (TWSE:2451)
Simply Wall St Value Rating: ★★★★★★
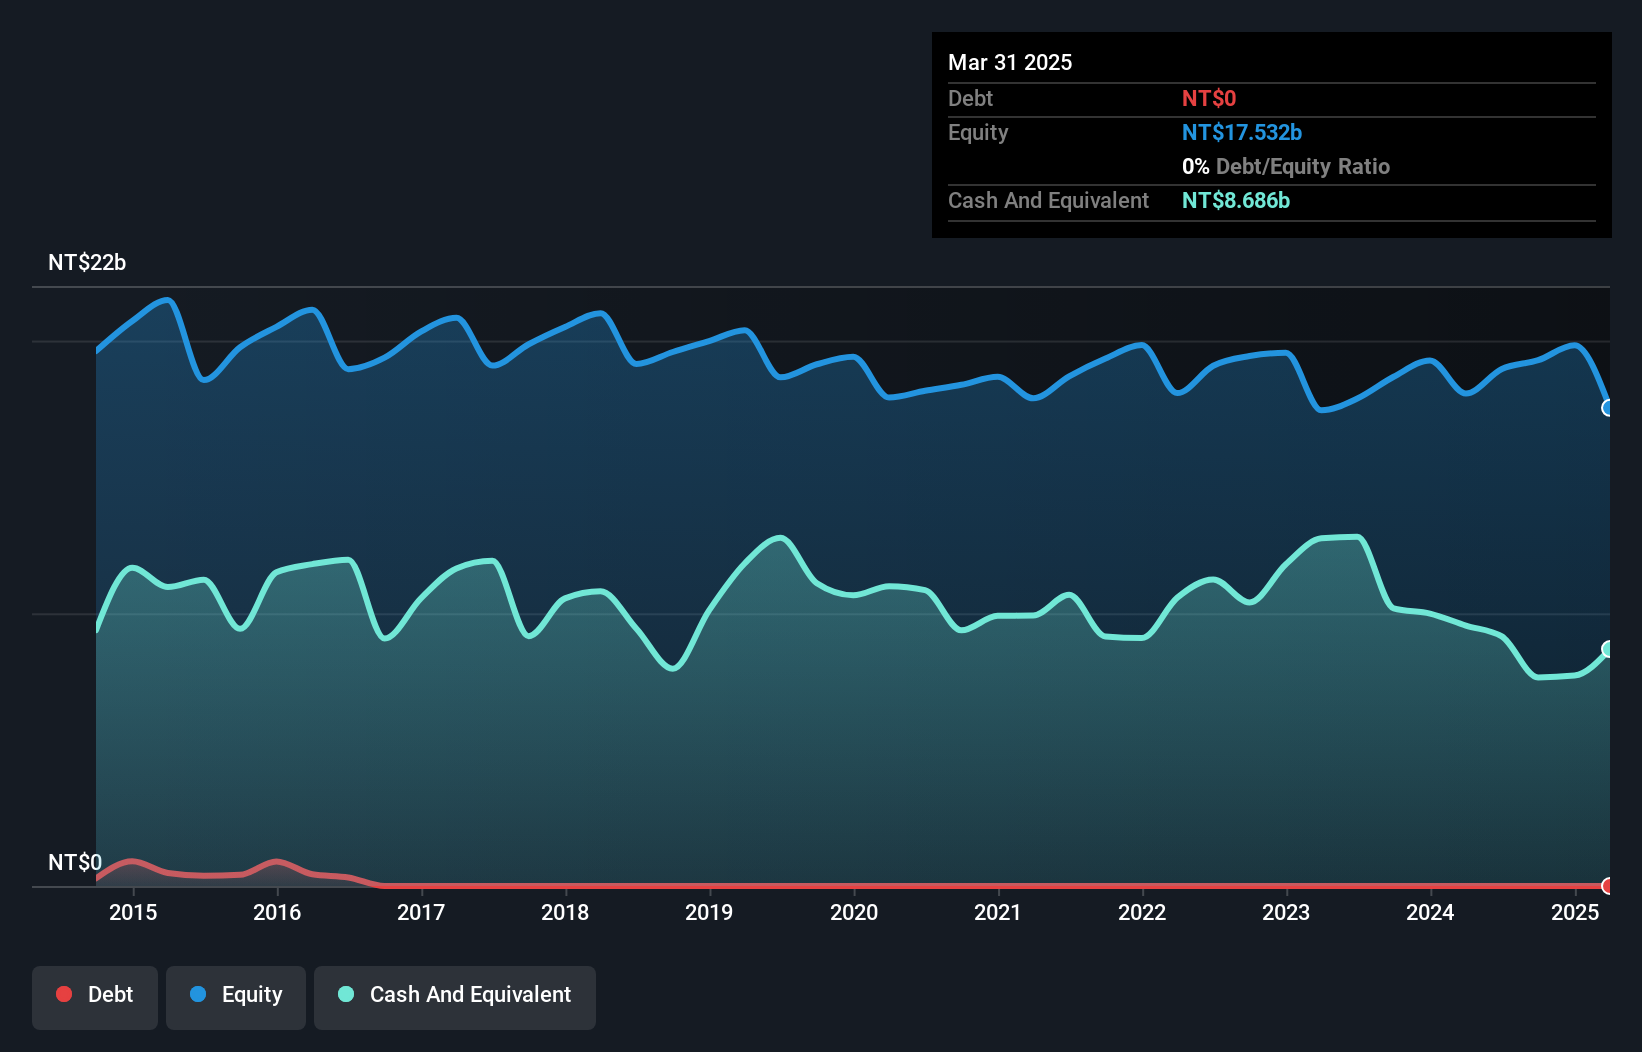
Overview: Transcend Information, Inc. is involved in the manufacturing, processing, and trading of computer software and hardware as well as peripheral equipment and parts across Taiwan, Asia, the United States, Europe, and other international markets with a market capitalization of NT$126.82 billion.
Operations: Transcend Information, Inc. generates revenue primarily from its computer peripherals segment, which accounts for NT$43.36 billion. The company operates across multiple regions including Taiwan, Asia, the United States, and Europe.
Transcend Information, a nimble player in the tech space, has shown remarkable earnings growth of 1463.3% over the past year, outpacing its industry peers by a wide margin. The company operates debt-free, eliminating concerns about interest coverage and offering robust financial health. Trading at 90.9% below its estimated fair value suggests potential undervaluation compared to similar firms in the sector. Despite high levels of non-cash earnings indicating quality issues, Transcend's free cash flow remains positive, reinforcing its operational efficiency and profitability stance without relying on external financing sources like debt or equity issuance.
Nan Pao Resins Chemical (TWSE:4766)
Simply Wall St Value Rating: ★★★★★☆
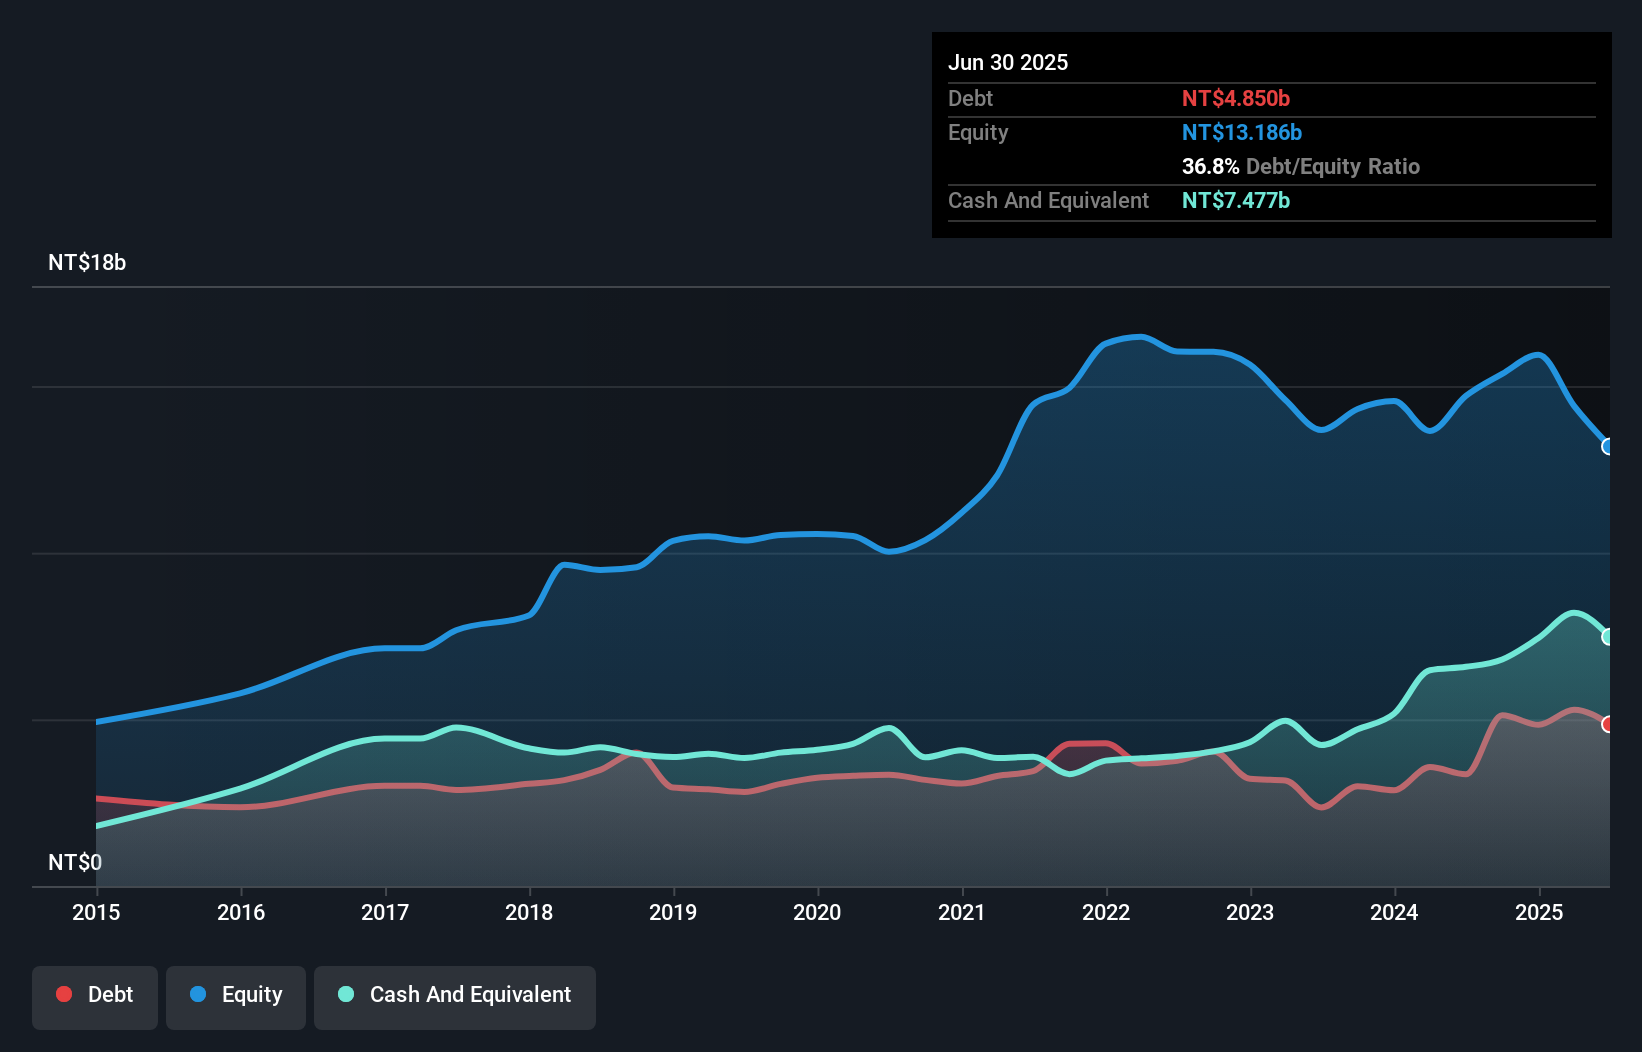
Overview: Nan Pao Resins Chemical Co., Ltd. operates in the manufacturing, wholesale, and retail sale of synthetic resins and plastics, adhesives, resin coatings, dyes, and pigments across various global regions with a market capitalization of approximately NT$43.59 billion.
Operations: The company generates revenue primarily from Taiwan (NT$9.18 billion), Vietnam (NT$7.33 billion), and Mainland China (NT$7.46 billion). Australia also contributes significantly with NT$3.78 billion in sales, while other regions add NT$2.78 billion to the total revenue stream. The net profit margin shows a notable trend, reflecting the company's operational efficiency across its diverse markets.
Nan Pao Resins Chemical, operating in the chemicals industry, reported impressive financials for Q2 2026 with sales reaching TWD 6.58 billion, up from TWD 5.81 billion the previous year. Net income climbed to TWD 876.58 million from TWD 553.54 million a year ago, showcasing robust growth despite not outpacing the industry's broader earnings surge of nearly 60%. The company's debt to equity ratio rose over five years from 23.9% to 37.2%, yet it holds more cash than its total debt, ensuring financial stability and effective interest coverage while trading at an attractive value below estimated fair value by nearly half (44%).
- Unlock comprehensive insights into our analysis of Nan Pao Resins Chemical stock in this health report.
Understand Nan Pao Resins Chemical's track record by examining our Past report.
Where To Now?
- Discover the full array of 135 Asian Undiscovered Gems With Strong Fundamentals right here.
- Are you invested in these stocks already? Keep abreast of every twist and turn by setting up a portfolio with Simply Wall St, where we make it simple for investors like you to stay informed and proactive.
- Maximize your investment potential with Simply Wall St, the comprehensive app that offers global market insights for free.
Curious About Other Options?
- Explore high-performing small cap companies that haven't yet garnered significant analyst attention.
- Fuel your portfolio with companies showing strong growth potential, backed by optimistic outlooks both from analysts and management.
- Find companies with promising cash flow potential yet trading below their fair value.
This article by Simply Wall St is general in nature. We provide commentary based on historical data and analyst forecasts only using an unbiased methodology and our articles are not intended to be financial advice. It does not constitute a recommendation to buy or sell any stock, and does not take account of your objectives, or your financial situation. We aim to bring you long-term focused analysis driven by fundamental data. Note that our analysis may not factor in the latest price-sensitive company announcements or qualitative material. Simply Wall St has no position in any stocks mentioned.
Have feedback on this article? Concerned about the content? Get in touch with us directly. Alternatively, email editorial-team@simplywallst.com