


- EMCOR Group reported third quarter 2026 sales of US$5,541.52 million and net income of US$399.93 million, alongside higher full year revenue guidance to a range of US$20.6b to US$21.0b.
- The combination of strong third quarter earnings per share above US$9 on a diluted basis and a larger full year revenue outlook reflects how EMCOR Group is currently converting project demand into higher profitability.
- We will now look at how EMCOR Group's raised 2026 revenue guidance could reshape the investment narrative you rely on.
Scan EMCOR Group's raised guidance against a curated field of infrastructure heavyweights and data center beneficiaries by checking the 43 power grid technology and infrastructure stocks that is now shaping this part of the market.
EMCOR Group Investment Narrative Recap
To own EMCOR Group, you need to believe the specialty contractor can keep turning a large, complex project funnel into durable earnings while managing cost pressure. The raised 2026 revenue outlook to US$20.6b to US$21.0b signals healthy demand. The key short term swing factor is how efficiently that work converts into profit as labor and subcontracting costs evolve.
The biggest near term risk is margin pressure in mechanical construction if the shift toward prime contractor roles and more guaranteed maximum price and cost plus work squeezes returns. The latest guidance upgrade does not remove that concern. It reflects that the volume of work is there to test EMCOR Group’s execution.
The most relevant update for that test is the fresh earnings print. Third quarter 2026 sales of US$5,541.52 million and net income of US$399.93 million, together with diluted EPS above US$9, indicate how EMCOR Group is currently handling higher project intensity and data center exposure at scale.
Across the first nine months of 2026, revenue of US$15,324.65 million and net income of US$1,109.11 million provide a clearer view of earnings quality and consistency. Those figures, alongside the guidance increase, put the spotlight on whether EMCOR Group can hold or improve profitability while labor markets, contract mix and integration of past acquisitions remain the core operational swing factors.
EMCOR Group's narrative projects US$26.2b revenue and US$2.1b earnings by 2029. This assumes 12.1% yearly revenue growth and an earnings increase of about US$0.7b from US$1.4b today.
Uncover why EMCOR Group's fair value indicates a 42% potential upside to its current price that could narrow quickly.
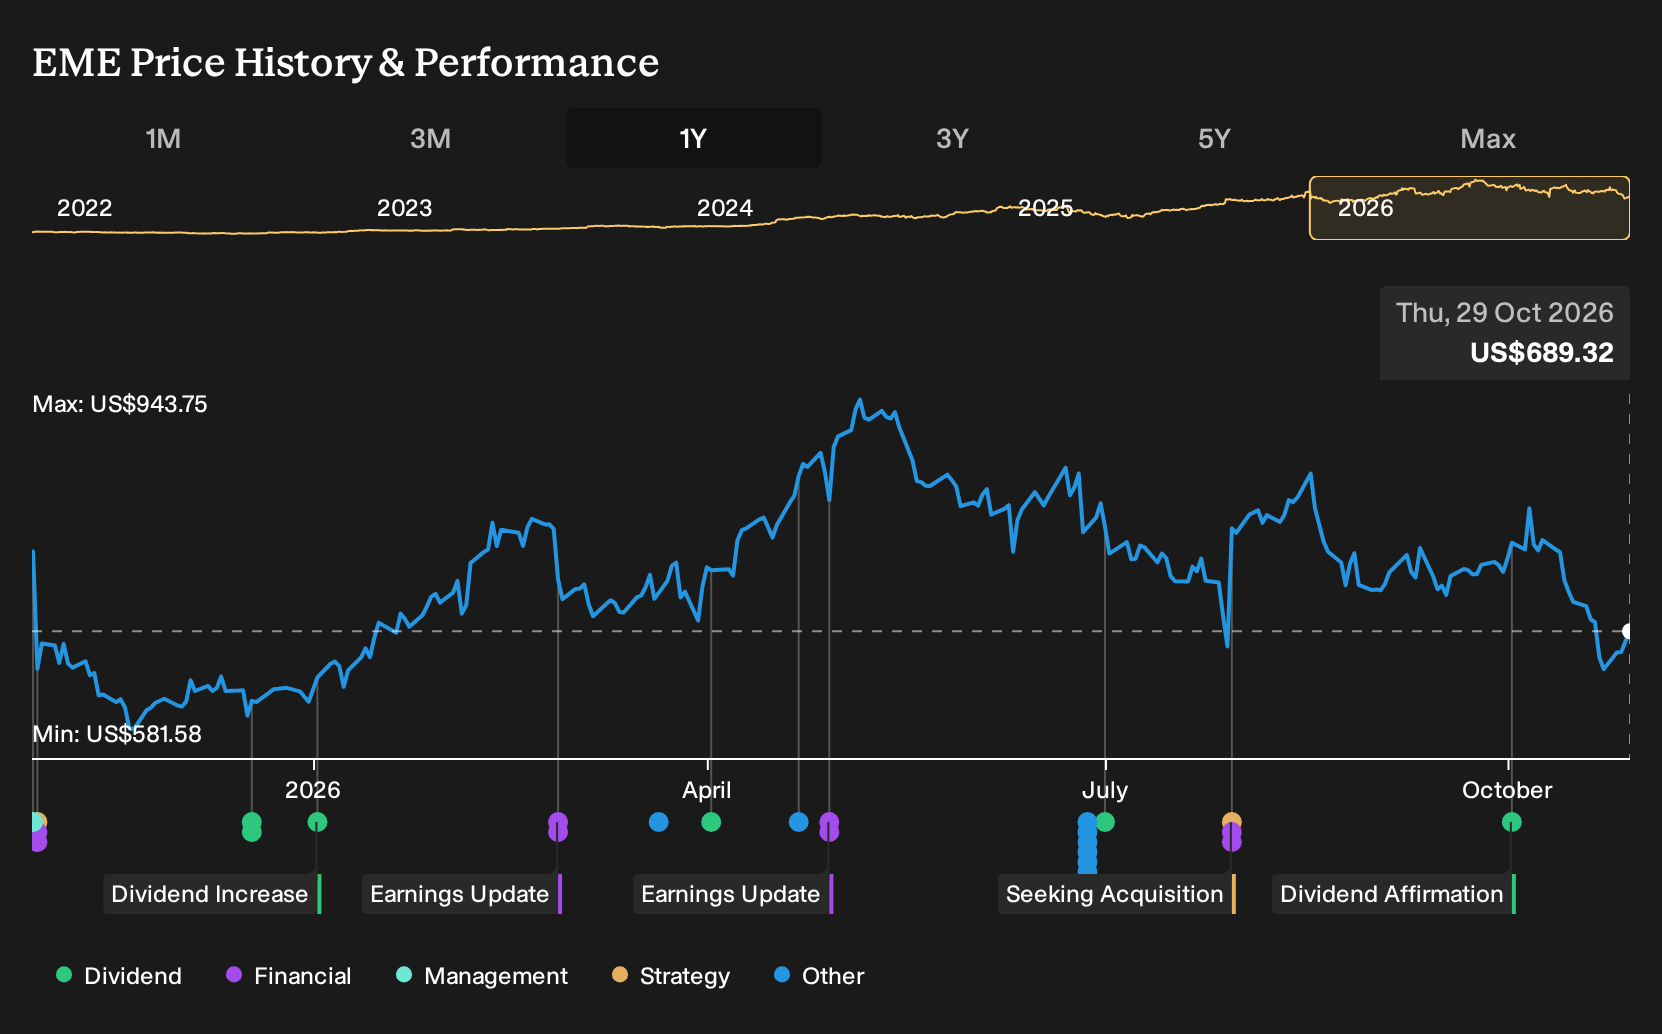
Exploring Other Perspectives
One alternate view on EMCOR Group focuses on margin risk rather than record guidance. The most cautious analysts were penciling in around US$25.8b of revenue and US$2.0b of earnings by 2029 before this update, implying only a small uplift from today. That is a much more restrained story than the consensus, and it highlights how differently you might read the same backlog and contract mix. Use this earnings beat and raised outlook as a prompt to compare those competing narratives before deciding which feels closer to your own expectations.
Explore 5 other EMCOR Group fair value estimates, including one that suggests it could be worth just $690.00.
Form Your Own Verdict
Don't just follow the ticker. Dig into the data and build a conviction that's truly your own.
- A great starting point for your EMCOR Group research is our analysis highlighting 4 key rewards that could impact your investment decision.
- See our latest analysis for EMCOR Group. The report includes a comprehensive fundamental analysis summarized in a single visual, the Snowflake, making it easy to evaluate EMCOR Group's overall financial health at a glance.
Looking For More EMCOR Group Investment Ideas?
If this EMCOR Group update has sharpened your thesis and you want to round out your watchlist, widen the lens to other businesses with different strengths and risk profiles using the Simply Wall St Screener.
- For investors who care most about balance sheet resilience and fundamental strength, start with a list of solid balance sheet and fundamentals (23 results) that can help anchor your portfolio around financial robustness.
- If potential mispricing is your focus, broaden your opportunity set with a 30 high quality undervalued stocks that pairs quality fundamentals with attractive pricing signals.
- For readers who prefer to get in early on under-followed stories, scan a 18 high quality undiscovered gems that highlights companies with strong underlying metrics but limited market attention.
Have feedback on this article? Concerned about the content? Get in touch with us directly. Alternatively, email editorial-team@simplywallst.com