


In recent weeks, global markets have experienced notable volatility driven by concerns over AI investment and rising oil prices, leading to mixed performances across major indices. As investors navigate these fluctuations, identifying undervalued stocks becomes crucial for those looking to capitalize on potential market inefficiencies. In the current environment, a good stock may be one that demonstrates strong fundamentals yet trades below its intrinsic value due to broader market pressures.
Top 10 Undervalued Stocks Based On Cash Flows
| Name | Current Price | Fair Value (Est) | Discount (Est) |
| Zhejiang Century Huatong GroupLtd (SZSE:002602) | CN¥11.79 | CN¥23.57 | 50% |
| Wacom (TSE:6727) | ¥824.00 | ¥1619.46 | 49.1% |
| Valmet Oyj (HLSE:VALMT) | €29.46 | €57.68 | 48.9% |
| Shenzhen Highpower Technology (SZSE:001283) | CN¥50.10 | CN¥99.77 | 49.8% |
| P.S.P. Specialties (SET:PSP) | THB7.40 | THB14.64 | 49.5% |
| KB Financial Group (KOSE:A105560) | ₩155300.00 | ₩305971.70 | 49.2% |
| Hanwha Ocean (KOSE:A042660) | ₩49400.00 | ₩97332.75 | 49.2% |
| Grupa Pracuj (WSE:GPP) | PLN55.10 | PLN108.84 | 49.4% |
| CTS (TSE:4345) | ¥780.00 | ¥1526.42 | 48.9% |
| Apator (WSE:APT) | PLN25.50 | PLN50.06 | 49.1% |
Underneath we present a selection of stocks filtered out by our screen.
Vusion (ENXTPA:VU)
Overview: Vusion S.A. provides digitalization solutions for commerce across various regions including France, Europe, the Middle East, Africa, Asia, and the Americas with a market cap of €2.23 billion.
Operations: The company's revenue primarily comes from installing and maintaining electronic shelf labels, generating €1.68 billion.
Estimated Discount To Fair Value: 47.8%
Vusion S.A. is trading at a significant discount to its estimated future cash flow value, with shares priced 47.8% below fair value estimates of €257.29. Despite becoming profitable this year, earnings are projected to decline by 12% annually over the next three years, contrasting with their recent net income improvement from a loss last year to €131.7 million for H1 2026. The company benefits from strong relative value compared to peers and industry benchmarks.
- Our comprehensive growth report raises the possibility that Vusion is poised for substantial financial growth.
- Unlock comprehensive insights into our analysis of Vusion stock in this financial health report.
Henan Lingrui Pharmaceutical (SHSE:600285)
Overview: Henan Lingrui Pharmaceutical Co., Ltd. is involved in the research, development, production, and sale of drugs in China with a market cap of CN¥11.34 billion.
Operations: Henan Lingrui Pharmaceutical Co., Ltd. generates revenue through its research, development, production, and sale of pharmaceutical products within China.
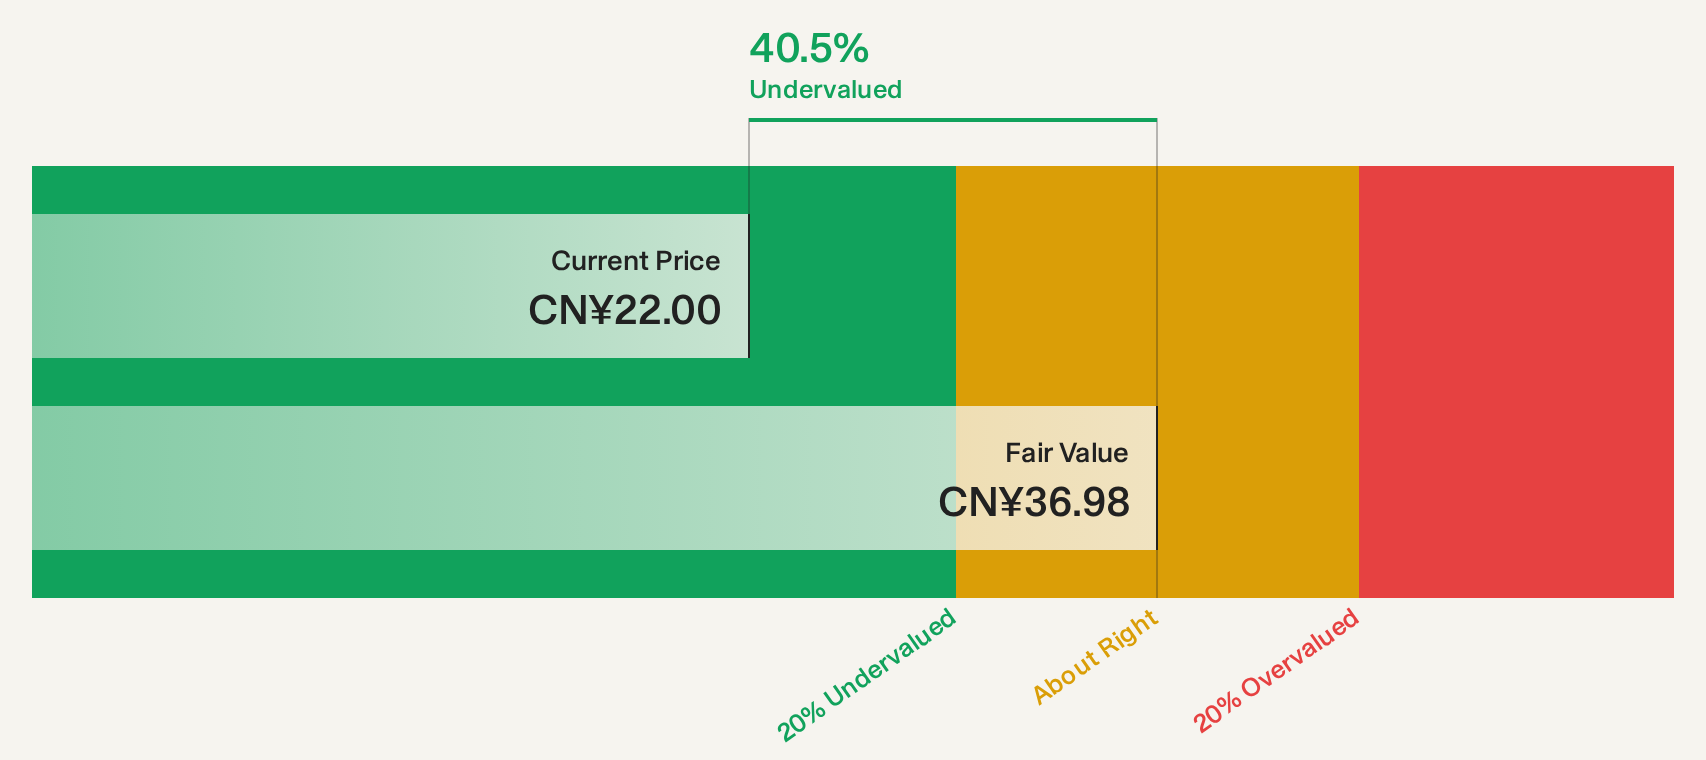
Estimated Discount To Fair Value: 40.5%
Henan Lingrui Pharmaceutical is trading at a substantial discount to its estimated future cash flow value, with shares priced 40.5% below fair value estimates of CNY 36.98. Recent earnings show improvement, with net income rising to CNY 718.8 million for the nine months ending September 2026 from CNY 650.93 million a year ago. Though earnings are forecast to grow at a moderate rate of 7.66% annually, this lags behind the broader CN market growth expectations of 26.9%.
- Insights from our recent growth report point to a promising forecast for Henan Lingrui Pharmaceutical's business outlook.
- Dive into the specifics of Henan Lingrui Pharmaceutical here with our thorough financial health report.
Hongfa Technology (SHSE:600885)
Overview: Hongfa Technology Co., Ltd. is a global manufacturer and supplier of relays, electrical appliances, equipment, connectors, capacitors, precision parts, and automation equipment with a market cap of approximately CN¥46.12 billion.
Operations: Hongfa Technology generates revenue through its global production and distribution of relays, electrical appliances, equipment, connectors, capacitors, precision parts, and automation machinery.
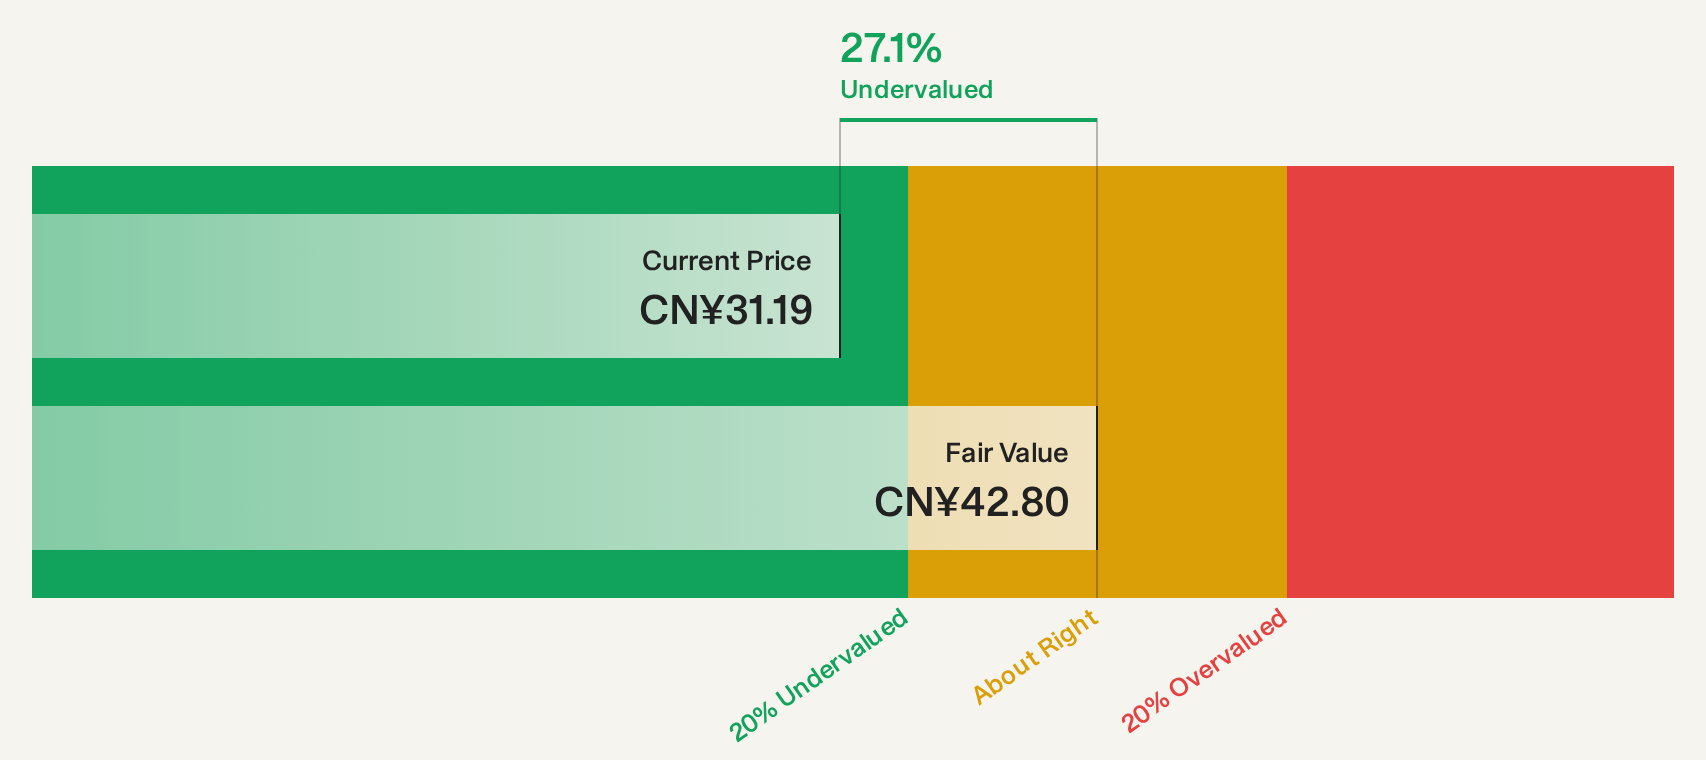
Estimated Discount To Fair Value: 27%
Hongfa Technology is trading at a significant discount to its future cash flow value, with a current price of CN¥31.23 against an estimated value of CN¥42.76. Recent earnings for the nine months ending September 2026 show sales increased to CN¥17.34 billion from CN¥12.91 billion, and net income rose to CN¥1.81 billion from CN¥1.47 billion year-on-year, indicating robust financial performance despite slower forecasted growth compared to the broader market.
- Our growth report here indicates Hongfa Technology may be poised for an improving outlook.
- Get an in-depth perspective on Hongfa Technology's balance sheet by reading our health report here.
Next Steps
- Dive into all 263 of the Undervalued Global Stocks Based On Cash Flows we have identified here.
- Hold shares in these firms? Setup your portfolio in Simply Wall St to seamlessly track your investments and receive personalized updates on your portfolio's performance.
- Streamline your investment strategy with Simply Wall St's app for free and benefit from extensive research on stocks across all corners of the world.
Searching for a Fresh Perspective?
- Explore high-performing small cap companies that haven't yet garnered significant analyst attention.
- Diversify your portfolio with solid dividend payers offering reliable income streams to weather potential market turbulence.
- Fuel your portfolio with companies showing strong growth potential, backed by optimistic outlooks both from analysts and management.
This article by Simply Wall St is general in nature. We provide commentary based on historical data and analyst forecasts only using an unbiased methodology and our articles are not intended to be financial advice. It does not constitute a recommendation to buy or sell any stock, and does not take account of your objectives, or your financial situation. We aim to bring you long-term focused analysis driven by fundamental data. Note that our analysis may not factor in the latest price-sensitive company announcements or qualitative material. Simply Wall St has no position in any stocks mentioned.
Have feedback on this article? Concerned about the content? Get in touch with us directly. Alternatively, email editorial-team@simplywallst.com