


The United States market has experienced a flat week but has seen a 10% increase over the past year, with earnings anticipated to grow by 17% annually in the coming years. In this environment, identifying small-cap stocks that are perceived as undervalued and have insider buying activity can present intriguing opportunities for investors seeking potential growth.
Top 10 Undervalued Small Caps With Insider Buying In The United States
| Name | PE | PS | Discount to Fair Value | Value Rating |
|---|---|---|---|---|
| Financial Institutions | 9.9x | 3.3x | 22.74% | ★★★★★☆ |
| Regional Management | 7.1x | 0.5x | 26.77% | ★★★★★☆ |
| Enovis | NA | 0.6x | 34.22% | ★★★★★☆ |
| Bank of the James Financial Group | 9.4x | 2.1x | 36.84% | ★★★★☆☆ |
| Tilray Brands | NA | 0.4x | 18.18% | ★★★★☆☆ |
| German American Bancorp | 12.7x | 4.8x | 41.94% | ★★★☆☆☆ |
| Shore Bancshares | 11.0x | 3.2x | 49.08% | ★★★☆☆☆ |
| Tennant | 62.1x | 0.9x | 20.15% | ★★★☆☆☆ |
| Peoples Financial | 29.2x | 4.0x | 32.60% | ★★★☆☆☆ |
| Orion Group Holdings | 64.1x | 0.4x | 48.38% | ★★★☆☆☆ |
Let's explore several standout options from the results in the screener.
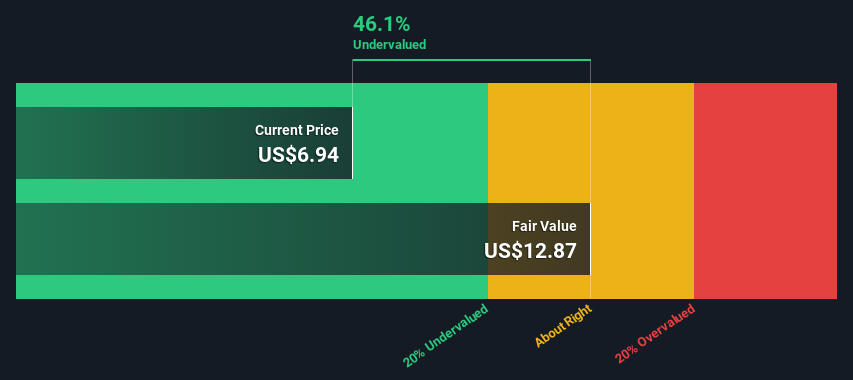
Fluence Energy (FLNC)
Simply Wall St Value Rating: ★★★★☆☆
Overview: Fluence Energy is a company that specializes in battery and energy storage solutions, with operations focused on providing advanced battery systems; it has a market cap of approximately $2.24 billion.
Operations: Fluence Energy generates its revenue primarily from battery systems, with recent figures reaching $2.63 billion. The company's cost of goods sold (COGS) was $2.39 billion, resulting in a gross profit margin of 9.36%. Operating expenses have been substantial, including significant allocations for R&D and general administrative costs. Despite these expenses, the company has consistently recorded net losses over recent periods, with a net income margin of -3.07% in the latest quarter ending June 2026.
PE: -10.8x
Fluence Energy, a smaller company in the U.S. market, recently signed a significant agreement with Vattenfall for a large battery storage project in Germany, highlighting its role in the growing utility-scale battery sector. Despite facing legal challenges and production delays that impacted financial performance and led to reduced guidance for 2026, insider confidence is evident from recent share purchases. With strategic leadership changes underway and an ambitious growth forecast of 60.98% annually, Fluence remains focused on expanding its global footprint amidst rising demand for energy storage solutions.
- Navigate through the intricacies of Fluence Energy with our comprehensive valuation report here.
Understand Fluence Energy's track record by examining our Past report.
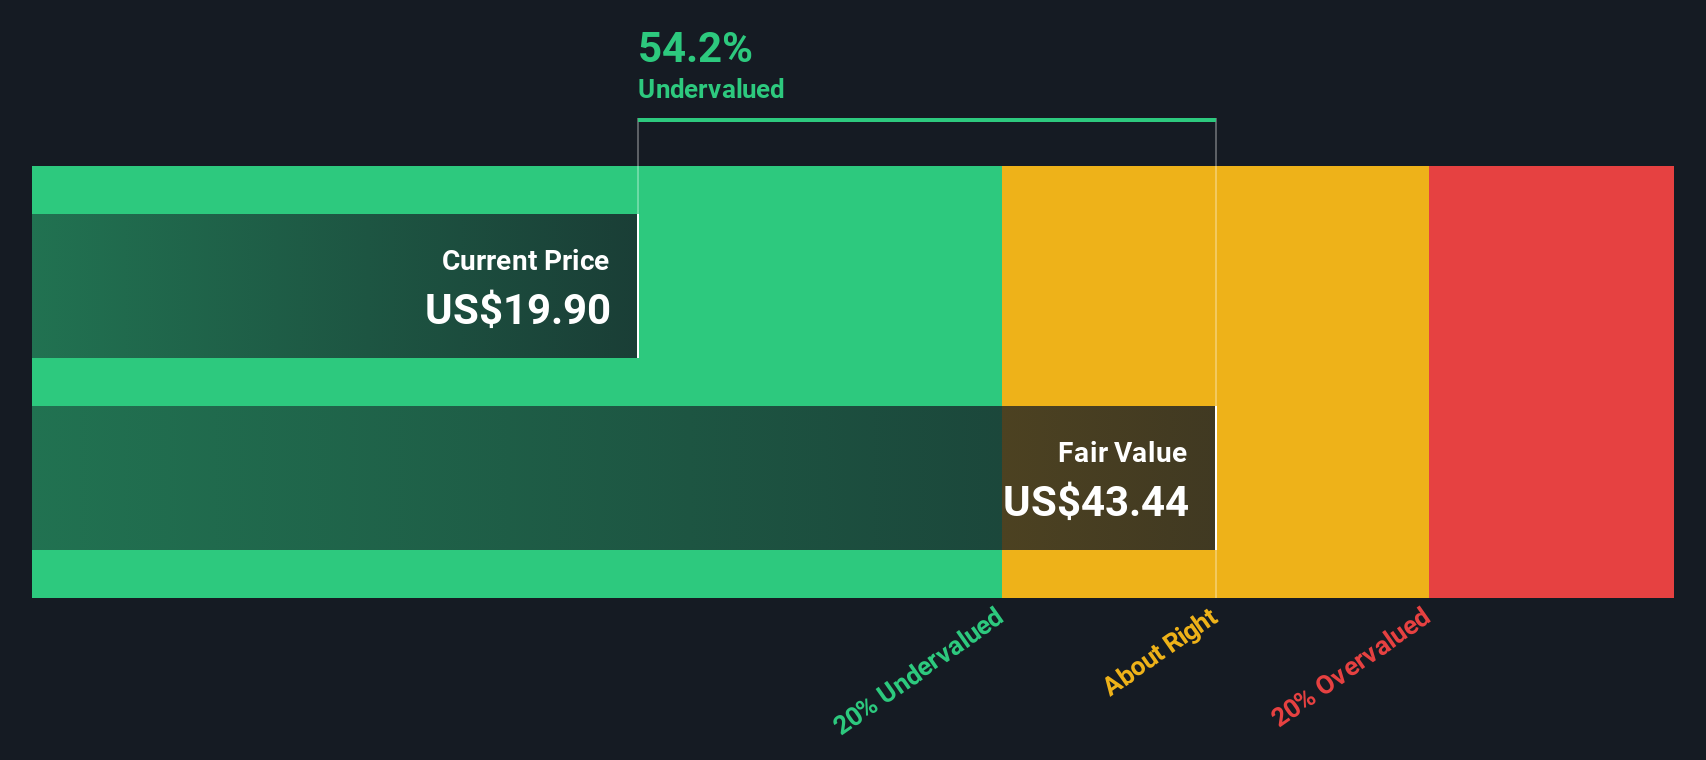
Ategrity Specialty Insurance Company Holdings (ASIC)
Simply Wall St Value Rating: ★★★★☆☆
Overview: Ategrity Specialty Insurance Company Holdings operates in the insurance industry, focusing on specialty insurance products, with a market capitalization of $1.25 billion.
Operations: ASIC generates revenue primarily through its insurance business, with a reported revenue of $526.38 million. The company experienced a notable increase in gross profit margin from 6.24% in 2023 to 28.38% by mid-2026, indicating improved cost management relative to revenue growth over this period.
PE: 12.0x
Ategrity Specialty Insurance Company Holdings, a smaller player in the insurance sector, has shown potential for growth with its earnings forecasted to increase by 12.95% annually. Despite relying solely on external borrowing for funding, which poses higher risk, the company is expanding its product offerings in niche markets like Life Sciences and Energy. Recent earnings results reveal a revenue rise to US$403 million over nine months compared to US$301 million last year. The company also repurchased 142,686 shares between April and June 2026 for US$2.83 million, reflecting insider confidence in its value proposition amidst evolving market dynamics.
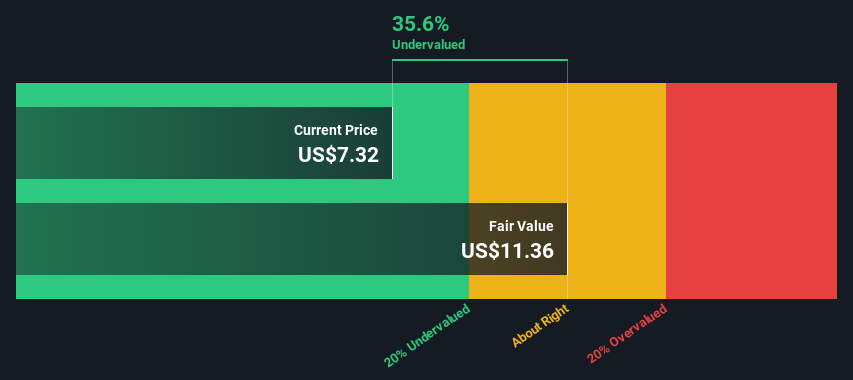
LSB Industries (LXU)
Simply Wall St Value Rating: ★★★★☆☆
Overview: LSB Industries is a chemical manufacturing company specializing in the production of ammonia and other related products, with a market cap of approximately $1.28 billion.
Operations: LSB Industries generates revenue primarily through its operations, with significant costs attributed to the cost of goods sold (COGS). Over recent periods, there has been a notable trend in the gross profit margin, which saw an increase from 0.0458% in December 2015 to 19.90% by September 2026. Operating expenses and non-operating expenses also play a crucial role in shaping net income outcomes.
PE: 17.4x
LSB Industries, a smaller player in the chemicals sector, recently reported strong financial performance with Q3 sales at US$158.6 million and net income doubling to US$16.35 million from the previous year. Earnings per share also improved significantly, indicating operational efficiency. Despite high debt levels due to reliance on external borrowing, insider confidence is evident as insiders have been purchasing shares throughout 2026, signaling optimism about future growth prospects amidst ongoing earnings improvements and strategic initiatives.
- Delve into the full analysis valuation report here for a deeper understanding of LSB Industries.
Review our historical performance report to gain insights into LSB Industries''s past performance.
Make It Happen
- Take a closer look at our Undervalued US Small Caps With Insider Buying list of 66 companies by clicking here.
- Already own these companies? Bring clarity to your investment decisions by linking up your portfolio with Simply Wall St, where you can monitor all the vital signs of your stocks effortlessly.
- Maximize your investment potential with Simply Wall St, the comprehensive app that offers global market insights for free.
Seeking Other Investments?
- Explore high-performing small cap companies that haven't yet garnered significant analyst attention.
- Fuel your portfolio with companies showing strong growth potential, backed by optimistic outlooks both from analysts and management.
- Find companies with promising cash flow potential yet trading below their fair value.
This article by Simply Wall St is general in nature. We provide commentary based on historical data and analyst forecasts only using an unbiased methodology and our articles are not intended to be financial advice. It does not constitute a recommendation to buy or sell any stock, and does not take account of your objectives, or your financial situation. We aim to bring you long-term focused analysis driven by fundamental data. Note that our analysis may not factor in the latest price-sensitive company announcements or qualitative material. Simply Wall St has no position in any stocks mentioned.
Have feedback on this article? Concerned about the content? Get in touch with us directly. Alternatively, email editorial-team@simplywallst.com