


Chipotle Mexican Grill, Inc. (CMG) reported strong Q3 results on Oct. 28, although its free cash flow (FCF) and FCF margins dipped YoY. CMG may be undervalued, but shorting puts could be a good play here.
CMG closed up 8.88% on Thursday, Oct. 29, at $31.28, after hitting a 6-month low of $27.52 on Oct. 23. That's after it peaked at $38.52 on Sept. 2, as seen in the Barchart chart below.
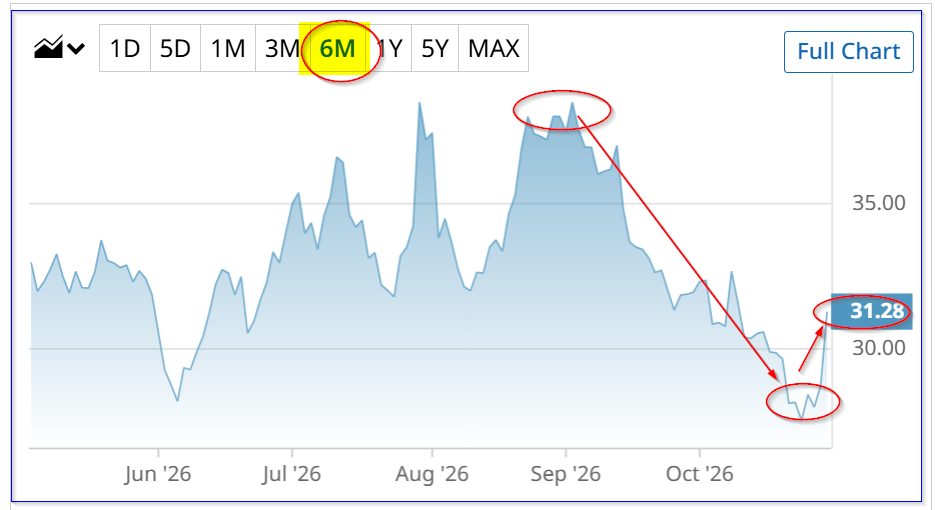
Is CMG's turnaround likely to continue? Maybe.
Based on management's outlook, analysts' forecasts, price targets, and its historical valuation, it could be worth over $40 per share, or +30% more.
What's more, one conservative way to play it is to sell short out-of-the-money (OTM) puts. Let's look at these points.
Strong Q3 Results
Chipotle's Q3 revenue was up 9.6% YoY, and its same-store sales rose 2.1%. In addition, net income fell 11%, and its diluted net income was off 6.9% from 29 cents last year to 27 cents this Q3.
Moreover, although Chipotle is still generating positive free cash flow (FCF), it was down 4% from last year. Its Q3 FCF margin was 10.54% vs. 13.52% a year ago. The trailing 12-month (TTM) margin fared better: 11.88% vs. 13.35% a year ago, according to Stock Analysis.
However, management provided a good outlook for next year, indicating it expects to open a similar number of new company-owned stores as in 2026.
As a result, analysts now project revenue will rise +10.7% from $13 billion in 2026 to $14.39 billion in 2027.
Therefore, if Chipotle can average an 11.5% margin, FCF could hit $1.655 billion (0.115 x $14.39b). That's almost 10% higher than its TTM FCF of $1.51 billion in Q3.
That could push CMG higher.
CMG Price Targets
For example, using a 3.33% FCF yield (i.e., 30 x FCF), Chiptotle's fair market value (FMV) could almost hit $50 billion:
$1.655b FCF x 30 = $49.65 billion FMV
That's about $10 billion more than its present $40 billion market cap, or 25% higher:
$49.65 billion FMV / $39.582 billion mkt cap (Yahoo! Finance) = 1.254 = 25.4% upside
In other words, CMG's price target, based on FCF, is $39.22 per share (i.e., 1.254 x $31.28).
Other analysts agree. For example, Yahoo! Finance's survey of 35 analysts is $40.77. Similarly, Barchart's mean survey PT is $42.39.
Another way to simply value CMG is with its historical forward P/E (price/earning) ratio. Morningstar's average forward P/E for the past 5 years is 38.33x. In fact, in 2025, it averaged 27x.
So, using analysts' 2027 $1.34 earnings per share (EPS) forecast and a 30x multiple, CMG would be worth $40.20 per share.
The bottom line is that CMG looks deeply undervalued, despite the lukewarm Q3 results.
CMG OTM Put Play
One conservative CMG play, in case it drops, is to sell short out-of-the-money (OTM) puts. That way, an investor can collect income while also setting a lower potential buy-in point.
For example, the Dec. 4, 2026, expiry period shows that the $29.00 strike price put option has a midpoint premium of $0.46. That gives a short-seller a 1.586% expected return (ER).
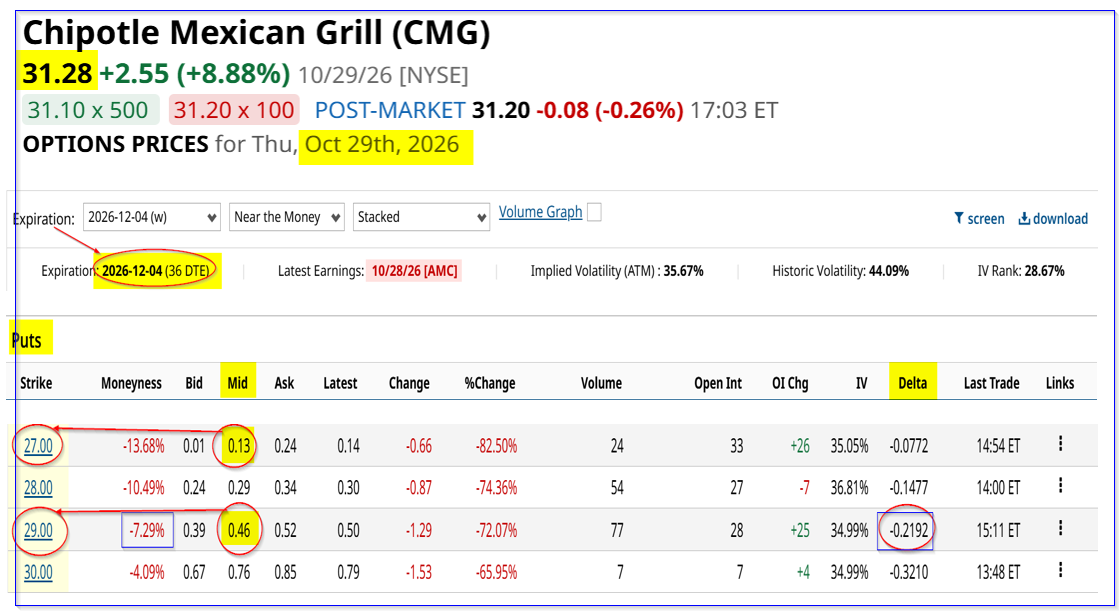
That means an investor who posts $2,900 in collateral can immediately collect $46, or 1.586% over the next month.
As long as CMG does not fall $2.28 or -7.3% to $29.00, the collateral will not be assigned to buy 100 shares. There is a good chance this will succeed. The delta ratio is -0.2192, implying a 78% chance of success.
Meanwhile, the investor has already collected $46, so the net potential buy-in price is $29.00-$0.46, or $28.54 (i.e., 8.76% lower).
CMG Put Credit Spread Play
For investors willing to take on more risk, for a much higher return, a put credit spread is attractive. For example, shorting the $29 put and also buying the $27.00 put results in a net credit of $33.00 (i.e., ($0.46 - 0.13) x 100).
That's less income than the $46 from shorting a put at $29.00. But here's the difference: the brokerage firm will only require $200 collateral, not $2,900 (i.e., ($0.29 -$0.27) x 100).
That means the at-risk capital is just $167 (i.e., $200 - $33), in return for $33. So, the at-risk expected return (ER) is almost 20% for the next month:
$33/$167 = 0.1976 = 19.76% ER
This risk is that CMG drops below $27.00 and the total collateral is lost. The breakeven point is $29 - $0.33, or $28.67, which is 8.34% below Thursday's close.
Here's how this play might work. The investor does 10 put credit spreads for $2,000 ($200 x10) in collateral. The income collected is $330 ($33 x 10), and the at-risk capital is $1,670.
Let's say the investor eventually closes the spread out with a 50% gain, i.e., $165, halfway through the expiry period. The ROI was $165/$2,000, or almost 8.25%.
That is 3.6x better than the $46 short-put play, with a 1.586% ER for a month. The risk is greater as well, so investors should only do this if they are willing to lose the collateral.
On the date of publication, Mark R. Hake, CFA did not directly have a position in any of the securities mentioned in this article. All information and data in this article is solely for informational purposes. For more information please view the Barchart Disclosure Policy here.