



Traffic solutions company Verra Mobility (NASDAQ:VRRM) reported Q3 2026 results beating Wall Street’s revenue expectations, but revenue fell by 1.2% year on year to $258.9 million. On the other hand, the company’s full-year revenue guidance of $955 million at the midpoint came in 0.7% below analysts’ consensus estimates. Its non-GAAP profit of $0.36 per share was 37.7% above analysts’ consensus estimates.
For more on Verra Mobility, read our free full research report.
Verra Mobility (VRRM) Q3 2026 highlights:
- Revenue $258.9 million vs S&P analysts’ consensus estimates of $240.9 million (1.2% year-on-year decline, 7.4% beat)
- Adjusted EPS $0.36 vs S&P analysts’ consensus estimates of $0.26 (37.7% beat)
- Adjusted EBITDA $103.9 million vs analysts’ consensus estimates of $85.63 million (40.2% margin, 21.4% beat)
- Revenue guidance The company reconfirmed its revenue guidance for the full year of $955 million at the midpoint
- Adjusted EPS guidance Management reiterated its full-year adjusted EPS guidance of $1.14 at the midpoint
- EBITDA guidance $365 million at the midpoint for the full year, in line with analysts’ consensus estimates
- Operating margin 25.3%, down from 28.6% in the same quarter last year
- Free cash flow margin 34.5%, up from 18.7% in the same quarter last year
- Market capitalization $507.6 million
Revenue growth
A company’s long-term performance is an indicator of its overall quality. Any business can experience short-term success, but top-performing ones sustain growth for years. Verra Mobility’s 15.9% annualized revenue growth over the last five years was strong. Its growth beat the average industrials company and shows its offerings resonate with customers.
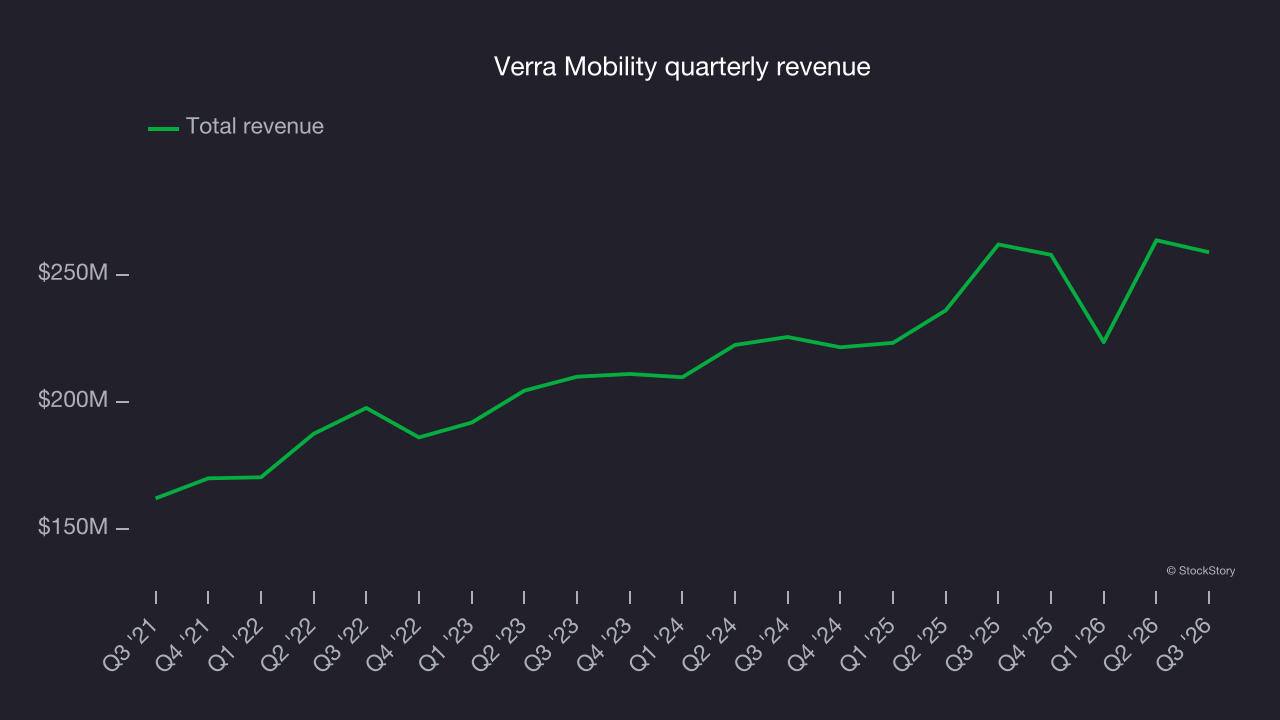
Long-term growth is the most important, but within industrials, a half-decade historical view may miss new industry trends or demand cycles. Verra Mobility’s recent performance shows its demand has slowed significantly as its annualized revenue growth of 7.5% over the last two years was well below its five-year trend. 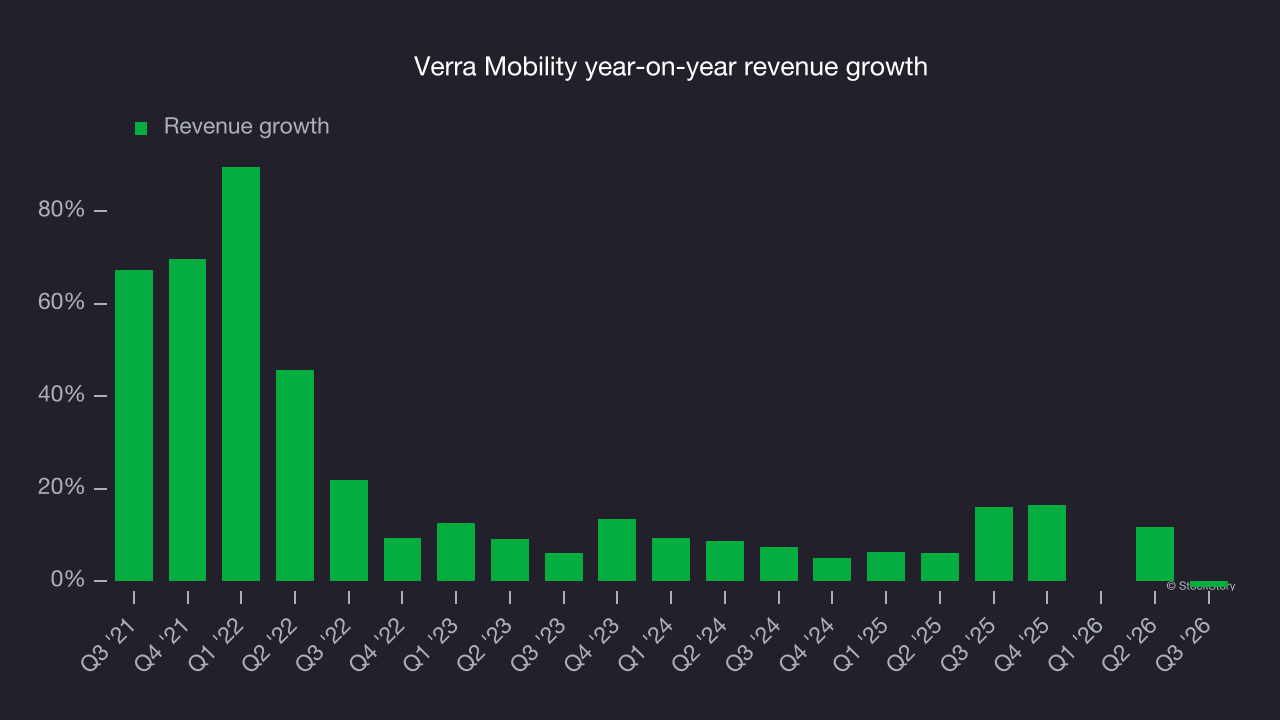
This quarter, Verra Mobility’s revenue fell by 1.2% year on year to $258.9 million but beat Wall Street’s consensus estimates by 7.4%.
Looking ahead, sell-side analysts expect revenue to decline by 9.2% over the next 12 months, according to S&P, a deceleration versus the last two years. This projection is underwhelming and suggests its products and services will see some demand headwinds.
Operating margin
Verra Mobility has performed well over the last five years. It demonstrated high profitability for an industrials business, with an average operating margin of 19.6%. That result is unsurprising given its favorable gross margin baseline.
Analyzing the trend in its profitability, Verra Mobility’s operating margin decreased by 9.3 percentage points over the last five years. This raises questions about the company’s expense base because its revenue growth should have given it leverage on its fixed costs, resulting in better economies of scale and profitability.
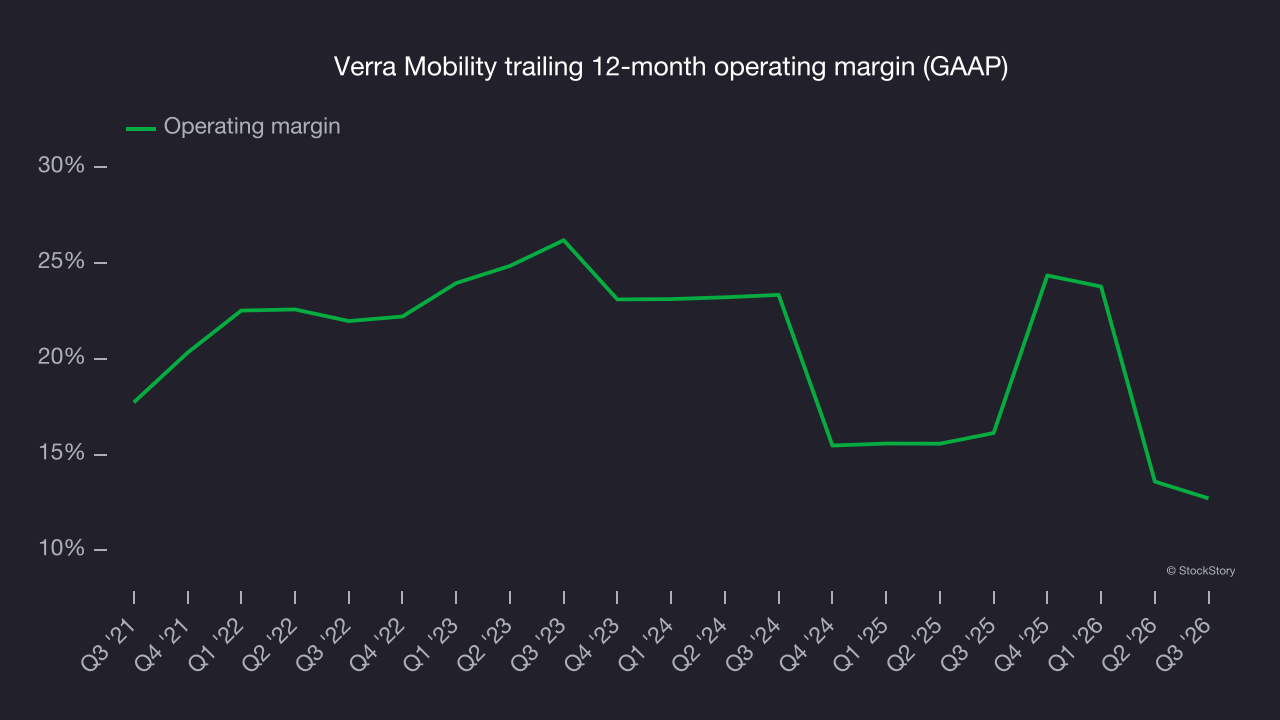
This quarter, Verra Mobility generated an operating margin of 25.3%, down 3.2 percentage points year on year. Its gross margin decreased more than its operating margin, suggesting its recent inefficiencies were driven more by weaker leverage on its cost of sales than by increased marketing, R&D and administrative overhead expenses.
Earnings per share
We track the long-term change in earnings per share (EPS) for the same reason as long-term revenue growth. Compared to revenue, however, EPS highlights whether a company’s growth is profitable.
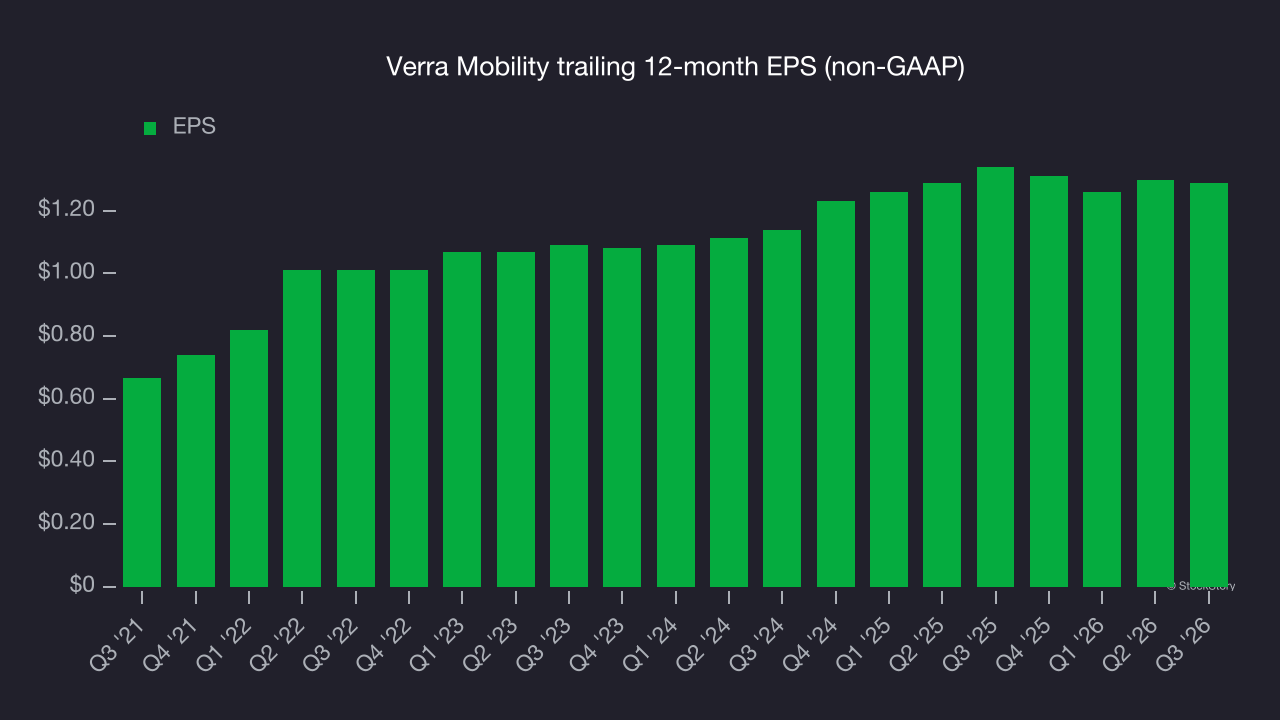
Verra Mobility’s strong 14.2% annual EPS growth over the last five years aligns with its revenue performance. This indicates it maintained its per-share profitability as it expanded.
Like with revenue, we analyze EPS over a more recent period because it can provide insight into an emerging theme or development for the business.
For Verra Mobility, its two-year annual EPS growth of 6.4% was lower than its five-year trend.
In Q3, Verra Mobility reported adjusted EPS of $0.36, down from $0.37 in the same quarter last year. Despite falling year on year, EPS comfortably beat analysts’ consensus estimates. Over the next 12 months, Wall Street expects Verra Mobility’s full-year EPS to shrink by 28.1% from $1.29 to $0.93, according to S&P.
Key takeaways from Verra Mobility’s Q3 results
Verra Mobility’s quarter had some key positives: EPS beat analysts’ consensus estimates and EBITDA topped Wall Street’s estimates by a wide margin. But full-year revenue guidance fell slightly short of expectations, leaving the results mixed overall. Investors were likely hoping for more, as shares plunged 10.5% to $2.99 immediately after the report.
Assessing Verra Mobility at its current price involves more than the latest quarter. Longer-term business quality, combined with valuation, can help determine whether the stock is a buy. For more, read our full research report here (it’s free).