


- Standex International reported fiscal first quarter 2027 sales of US$232.58 million and net income of US$24.17 million, with both basic and diluted EPS above the prior year and ahead of analyst expectations.
- The earnings beat highlights how Standex International's higher margin engineered components and grid focused portfolio can translate stronger demand into higher profitability at the bottom line.
- Next, the focus will be on how Standex International's earnings beat and higher profitability shape the longer term investment narrative.
Scan how Standex International's earnings beat and fresh buyback plan compare with other industrials under similar pressure by reviewing the hand picked list of solid balance sheet and fundamentals (23 results) in one place.
Standex International Investment Narrative Recap
To own Standex International, you need to buy into a fairly simple idea. This is an engineered components manufacturer leaning into grid, electrification, and aerospace demand, and then translating that mix into healthy margins. The latest quarter, with US$232.58 million of sales and US$24.17 million of net income, broadly supports that operating story in the near term.
The key short term swing factor remains how consistently Standex International can keep organic growth coming from Electronics and Aerospace & Defense while it builds out grid capacity. The main risk is that organic momentum cools or new grid investments and deals fail to earn in line with past returns. That outcome would pressure earnings progress.
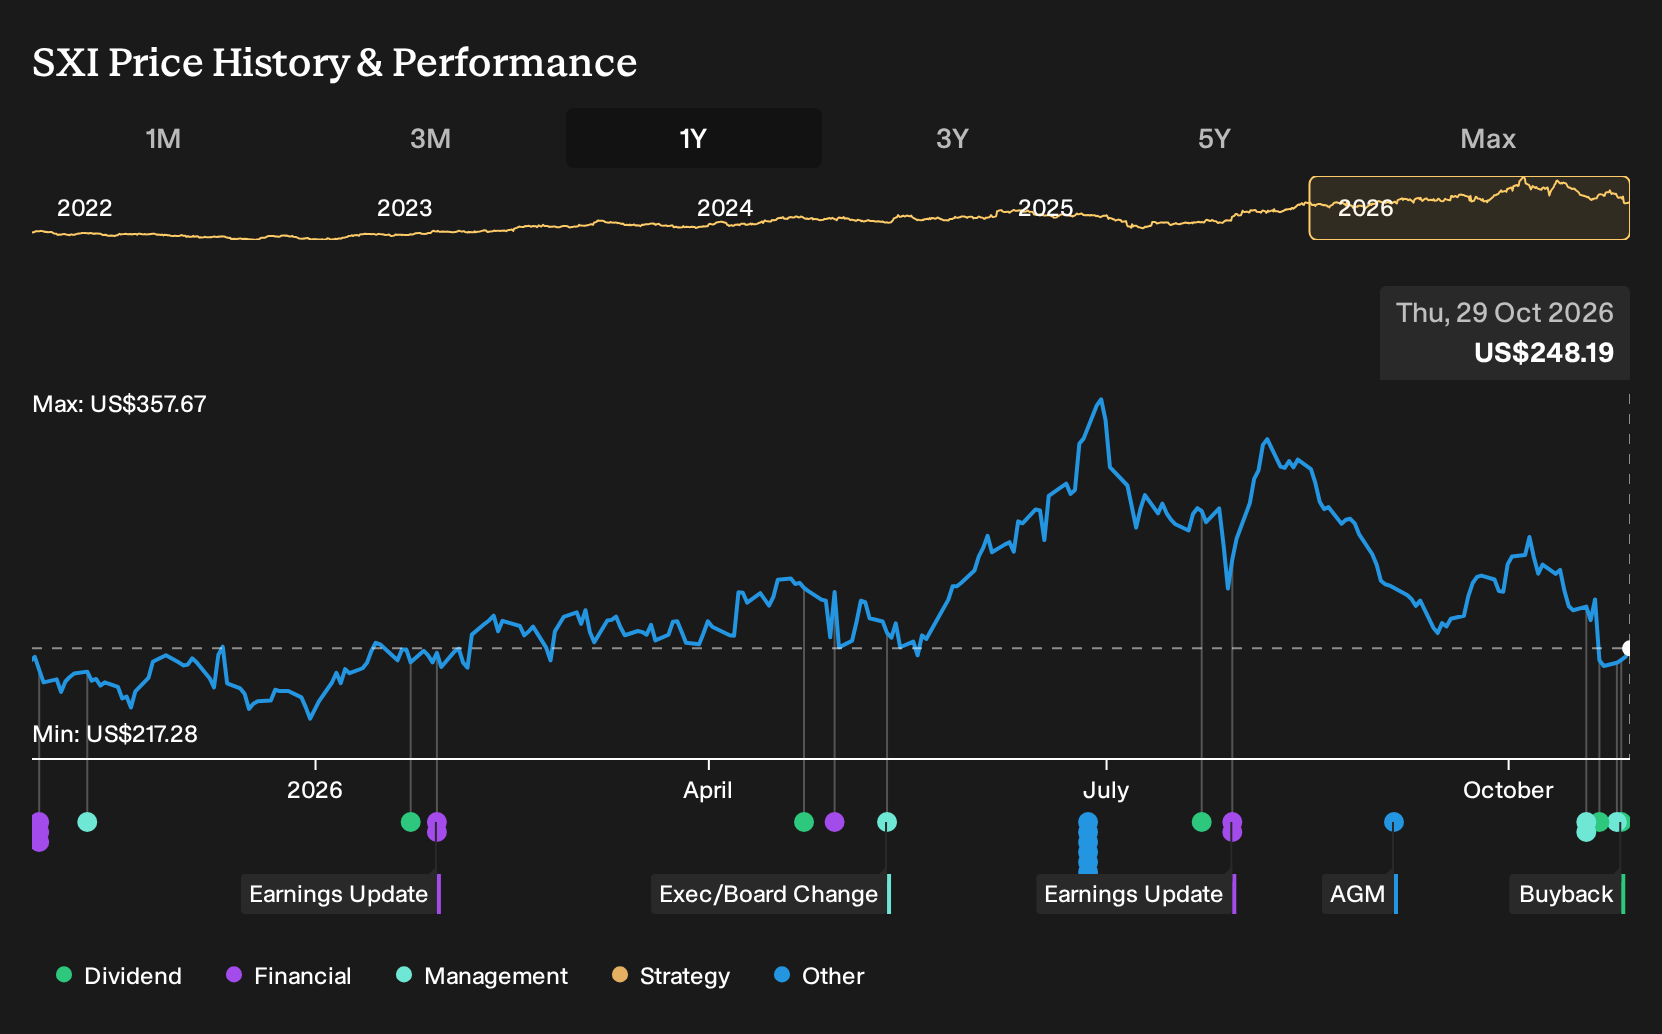
The fresh US$100 million share repurchase authorization is the announcement that ties closest to this earnings beat. The prior program retired 596,592 shares for US$77.03 million, about 5.05% of the company. The new plan extends that capital return framework into the next phase of Standex International’s grid and high margin components build out.
For you as an investor, the buyback plan matters because it interacts directly with the current valuation, analyst expectations and execution risk. Stronger earnings paired with ongoing repurchases can support per share results if cash generation keeps pace. If operating cash flow coverage of debt or returns on new projects disappoint, aggressive repurchasing could limit flexibility just as organic growth slows.
Standex International Consensus Assumptions In Focus
Analysts are effectively sketching a roadmap for Standex International that runs out to 2029 and ties the current share price to specific revenue and profit targets. The core blueprint calls for revenue to grow at about 7.7% a year over the next three years, with profit margins rising from 11.8% today to 14.8% over that period as the mix shifts further toward engineered components and grid exposure.
The earnings side of that picture is more concrete. Consensus projections point to earnings of US$164.5 million by around October 2029, compared with US$104.8 million today, with some analysts modeling as much as US$201.6 million. Those figures sit on top of an assumption that the share count stays roughly flat, so most of the per share gains would need to come from actual profit growth rather than financial engineering.
Valuation expectations then layer on top of these operating assumptions. To line up with the analyst case, an investor would need to accept that by 2029 Standex International can generate about US$1.1b of revenue and US$164.5 million of earnings, and that the stock trades on a P/E of 32.1x versus about 33.4x today and an industry level cited at 24.5x. Those inputs, discounted at around 8.8%, underpin the consensus price target of US$338.40 compared with the current share price of US$288.59, which implies 14.7% upside baked into the models as of late 2026.
Standex International’s narrative projects about US$1.1b of revenue and US$164.5 million of earnings by 2029. This assumes revenue grows around 7.7% a year and earnings rise roughly US$59.7 million from US$104.8 million today.
Uncover why Standex International's fair value indicates a 36% potential upside to its current price that may not last much longer.
Exploring Other Perspectives
The Simply Wall St Community has only two fair value views on Standex International, stretching from about US$192 to US$338, so opinions already span deep discount to full alignment with the current analyst target. When you add the new US$100 million buyback, dividend increase, leadership changes and electrification driven grid build out, you get a mix that can push expectations in very different directions. Use that spread as a prompt to explore more than one angle before deciding how this stock fits your own risk and return trade off.
Explore another Standex International fair value estimate, including one that suggests as much as 22% downside from the current price.
The Verdict Is Yours
Disagree with existing narratives? Extraordinary investment returns rarely come from following the herd, so consider trusting your own analysis and judgment.
- A great starting point for your Standex International research is our analysis highlighting 3 key rewards and 3 important warning signs that could impact your investment decision.
- See our latest analysis for Standex International. The report includes a comprehensive fundamental analysis summarized in a single visual, the Snowflake, making it easy to evaluate Standex International's overall financial health at a glance.
Looking For More Investment Ideas Beyond Standex International?
If the Standex International story has sharpened your view on quality and risk, use that same lens to scan a broader watchlist. The Simply Wall St Screener can help you spot other companies with balance sheets, income profiles, and cash flows that line up with the way you like to invest.
- If you want to focus on stronger financial footing and cleaner leverage, start with a list of solid balance sheet and fundamentals (23 results) that already passes basic resilience checks.
- If valuation discipline sits at the center of your process, filter for companies trading below their assessed worth by using a curated 30 high quality undervalued stocks that may warrant closer inspection.
- If you prefer cash returns today as much as potential growth tomorrow, zero in on income opportunities through a hand picked 7 dividend fortresses that aims to combine higher yields with durability.
Have feedback on this article? Concerned about the content? Get in touch with us directly. Alternatively, email editorial-team@simplywallst.com