


What Kemira Oyj’s latest earnings signal for shareholders
Kemira Oyj (HLSE:KEMIRA) has just posted third quarter figures that show sales edging up while profit and earnings per share declined, paired with a reiterated full year 2026 revenue outlook under pressure from weak end markets.
Investors have absorbed that weaker earnings message quickly. Kemira Oyj’s 1-day share price return of 0.53% left the stock at €15.26. However, momentum has faded, with a 30-day share price decline of 11.33% and a year-to-date drop of 22.30%. The 5-year total shareholder return of 37.85% points to a much stronger longer-run experience than the past year’s 16.60% total shareholder return suggests.
Scan how Kemira Oyj’s recent setback compares with other materials players facing similar demand pressure by reviewing the hand picked list of solid balance sheet and fundamentals (201 results).
Kemira Oyj now trades at a clear discount to both analyst targets and an estimated intrinsic value after a sharp reset on weaker earnings. Is that pricing cushion enough to offset the profit headwinds investors just saw?
Most Popular Narrative: 19% Undervalued
The most followed narrative pegs Kemira Oyj’s fair value at €18.95 per share, above the last close of €15.26. That gap rests heavily on how the water focused expansion and cost measures play out against raw material pressures.
The main thing that has to go right is that Kemira Oyj turns its water focused M&A, PFAS remediation materials pipeline and cost saving measures into resilient profitability despite Iran war related raw material and logistics cost inflation and structurally weaker pulp, packaging and hygiene end markets.
See why 24 investors see Kemira Oyj as 19% undervalued.
Result: Fair Value of €18.95 (UNDERVALUED)
Still, that valuation cushion rests on shaky ground if Iran war related raw material inflation persists or if weak pulp, packaging and hygiene demand drags on longer.
Find out about the key risks to this Kemira Oyj narrative.
Another view on Kemira Oyj’s valuation
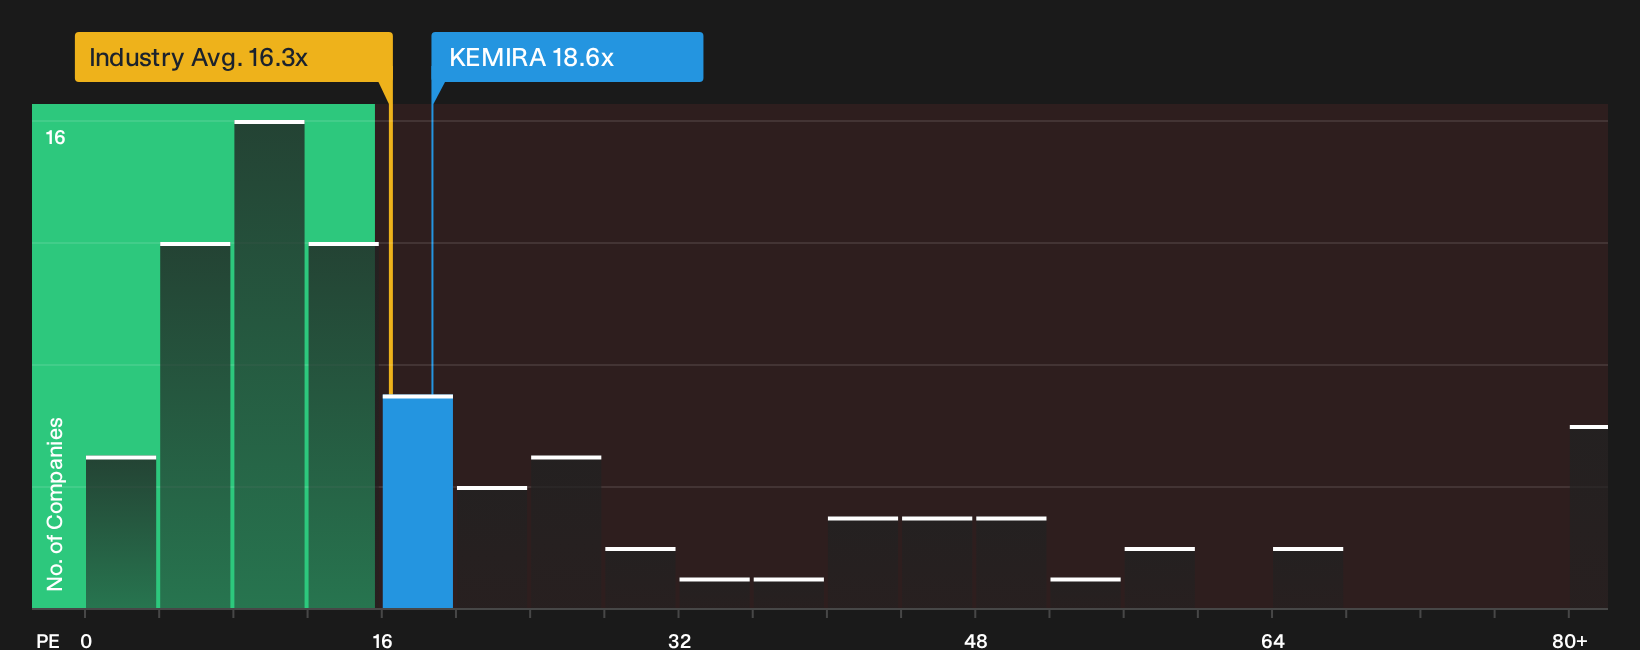
The story looks different once you shift from fair value models to a simple P/E yardstick. Kemira Oyj trades on 18.6x earnings, above the European Chemicals industry on 16.3x, yet below an estimated fair ratio of 22.7x. Is that premium a warning sign or a margin of safety in disguise?
To unpack what that pricing gap could mean for both downside risk and upside potential, take a closer look at valuation drivers with See what the numbers say about this price — find out in our valuation breakdown.
For a snapshot of how Kemira Oyj’s multiple stacks up against peers at a glance, refer to the latest
Next Steps
Mixed messages on Kemira Oyj can be useful if you let them challenge your own view. Take a moment to weigh the upside and downside yourself, then ground that judgment in the 2 key rewards and 2 important warning signs.
Looking for more investment ideas beyond Kemira Oyj?
If Kemira Oyj has you reassessing your portfolio, do not stop there. Use the same disciplined lens to hunt for stronger balance sheets, income streams and upside.
- Target greater resilience by scanning a 220 resilient stocks with low risk scores basket that filters for businesses with sturdier fundamentals and calmer risk profiles.
- Chase better value by reviewing a 606 high quality undiscovered gems set of under-the-radar companies that pair solid financials with quieter share price attention.
- Build a sturdier core by checking a 223 dividend fortresses lineup focused on higher yielding payers that still aim to keep their finances in good shape.
Have feedback on this article? Concerned about the content? Get in touch with us directly. Alternatively, email editorial-team@simplywallst.com