


Oriola Oyj walked into Q3 2026 earnings with a bruised share chart and a price of €0.78 that reflects deep skepticism after a weak few months. The headline this quarter is simple. The pharmaceutical distributor moved back into the black with basic earnings per share of €0.01 on €53.1m of revenue, after reporting losses earlier in the year.
That swing to profit looks small in euro terms yet it hits sentiment hard. Short term traders are reacting to a turnaround in profitability while longer term holders still see a business with trailing 12-month losses and a low valuation that already bakes in a lot of doubt.
Love the return to profit at Oriola Oyj but worried it could still be a fragile turnaround story? Compare this setup with companies from our list of solid balance sheet and fundamentals stocks (202 results)
Q3 2026 Earnings Summary
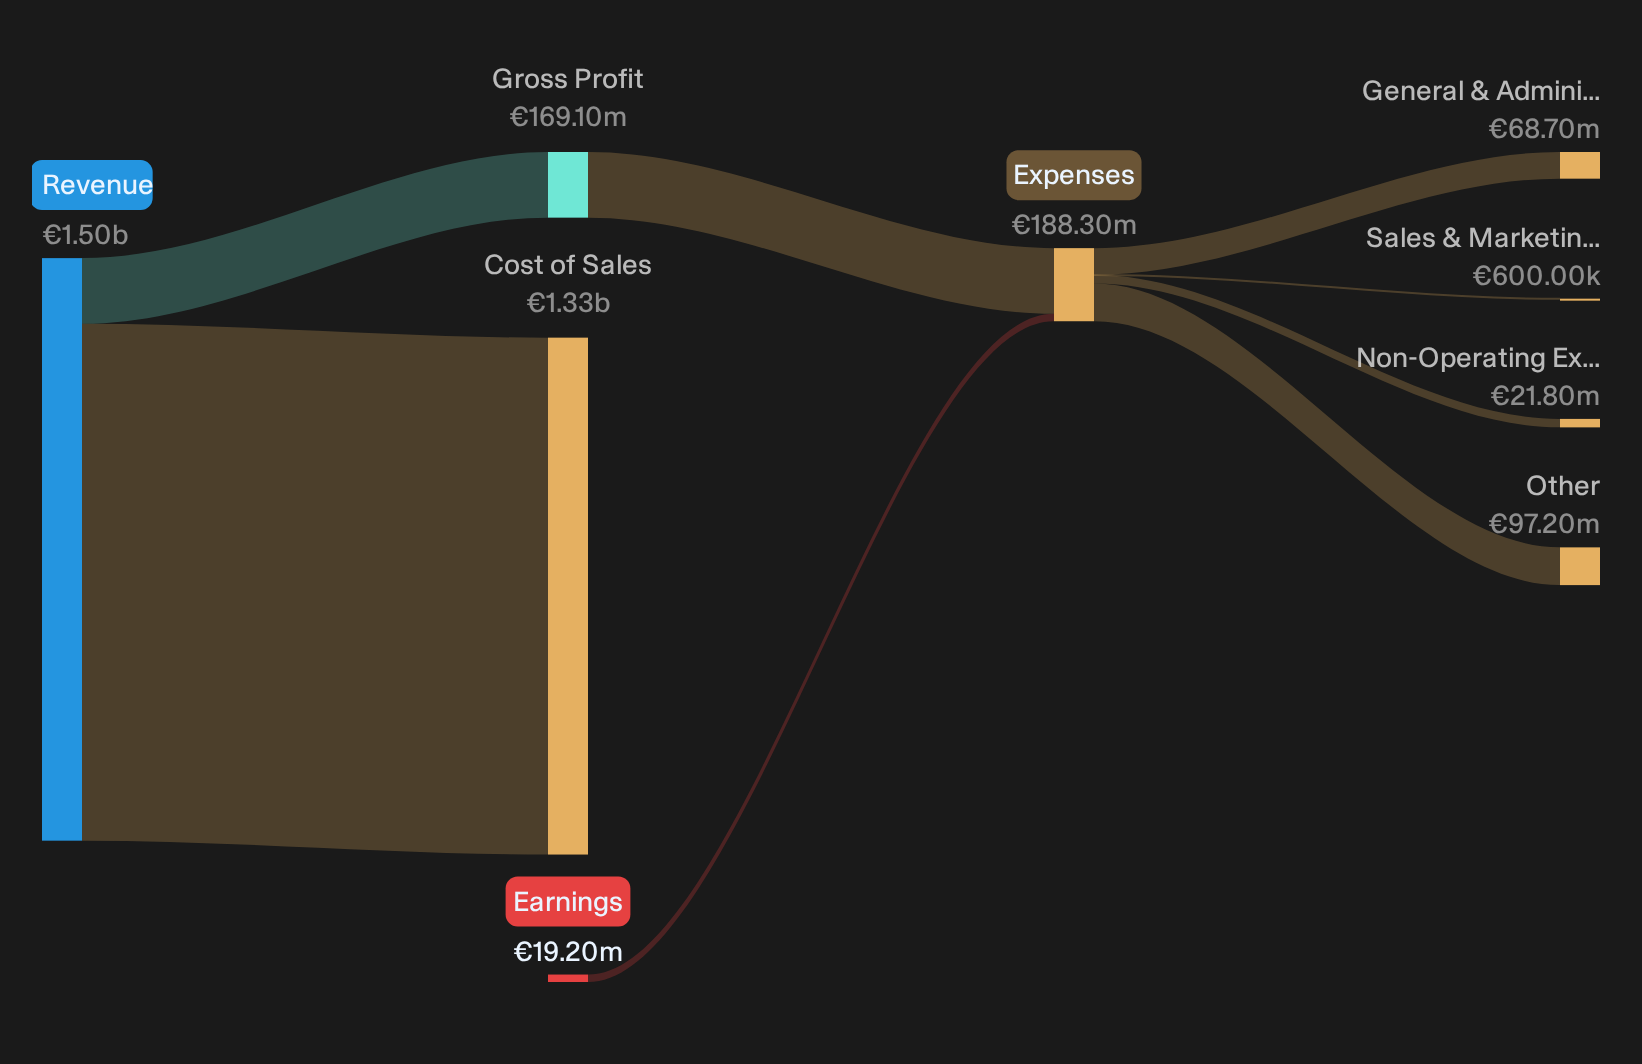
- Revenue (Q3 2026 vs. Q3 2025): €53.1m vs. €463.3m (large reported decline, reflecting different reporting scope and quarter structure)
- Net Income/Loss (Q3 2026 vs. Q3 2025): €2.0m profit vs. €1.7m profit (small improvement in bottom line)
- Basic EPS (Q3 2026 vs. Q3 2025): €0.01 vs. €0.009177 (modest increase per share)
- Trailing 12-Month Net Income (Q3 2026 vs. Q3 2025): loss of €19.2m vs. loss of €27.1m (reduced full year loss, still unprofitable over the period)
Oriola kept its bold 2029 EBITDA target despite higher ERP capex. Ask Charlie what could derail Oriola’s 2029 EBITDA doubling plan.
Oriola bullish story: operational progress versus profit mix
The optimistic view hangs on Oriola turning volume wins and better mix into healthier earnings quality.
"Continued structural growth in pharmaceutical distribution volumes in Sweden and stable demand in Finland, combined with Oriola retaining all key customer contracts and onboarding new ones, is expected to support sustained top line expansion and improving adjusted EBITDA."
Q3 net sales rose 5.1% with both Services and Products contributing, which backs the contract retention and volume angle. Adjusted EBITDA in the quarter was roughly unchanged though. Once the €0.7m inventory provision is stripped out, underlying margin improvement is modest rather than transformative.
Oriola bearish risks: ERP strain and margin dilution
The cautionary narrative focuses on systems strain and a weaker mix undermining any earnings recovery.
"The multi year ERP implementation is already depressing the equity ratio to about 13% and inflating adjusting items. If costs overrun or benefits in 2027 and 2028 are delayed or smaller than expected, this could further weaken equity, constrain dividends and keep reported earnings under pressure."
Q3 confirms higher ERP and Jarvenpää capex, now guided at €54m, with about €29m still to come. Equity ratio is described as broadly stable and the quarter returned to a €2.0m profit, so execution risk is present but has not yet translated into fresh balance sheet deterioration.
One Narrative disagrees with today's price. → See where this Narrative says Oriola Oyj should trade.
Hunt Quiet Disconnects In Plain Sight
Oriola Oyj just reminded investors that even a small profit change can quickly reshape expectations around a weak share price trend. The real opportunity could sit in companies where fundamentals and market pricing appear significantly misaligned.
- Company 1 - 48% below our estimate - targets higher margin gear segments while channeling more demand through direct and acquired accessory platforms.
- Company 2 - 43% below our estimate - connects merchants to local payment options as transaction volumes extend into additional sectors and regions.
- Company 3 - 30% below our estimate - ramps high value drug development and manufacturing capacity as clients shift more late stage and commercial projects.
Three companies from the same screener. Open all 201 potentially undervalued companies →
Have feedback on this article? Concerned about the content? Get in touch with us directly. Alternatively, email editorial-team@simplywallst.com