


Incap Oyj stock closed at €9.17 on Friday after reacting to fresh Q3 2026 numbers. The immediate focus sat on a sharp step up in earnings per share to €0.23 and revenue of €81.315 million, solid figures for an electronics manufacturing services player. Short term traders have already marked their verdict into the price. Longer term investors are more likely to weigh these quarterly profits against the trailing 12 month net margin of 7% and the current P/E of about 14.3x to judge how much earnings power they are really paying for.
If you like the Q3 earnings profile at Incap Oyj but want a wider set of manufacturers with solid profitability metrics to compare it with, check out our list of solid balance sheet and fundamentals stocks (202 results) as a starting point for finding peers that blend earnings power with balance sheet strength.
Q3 2026 Earnings Summary
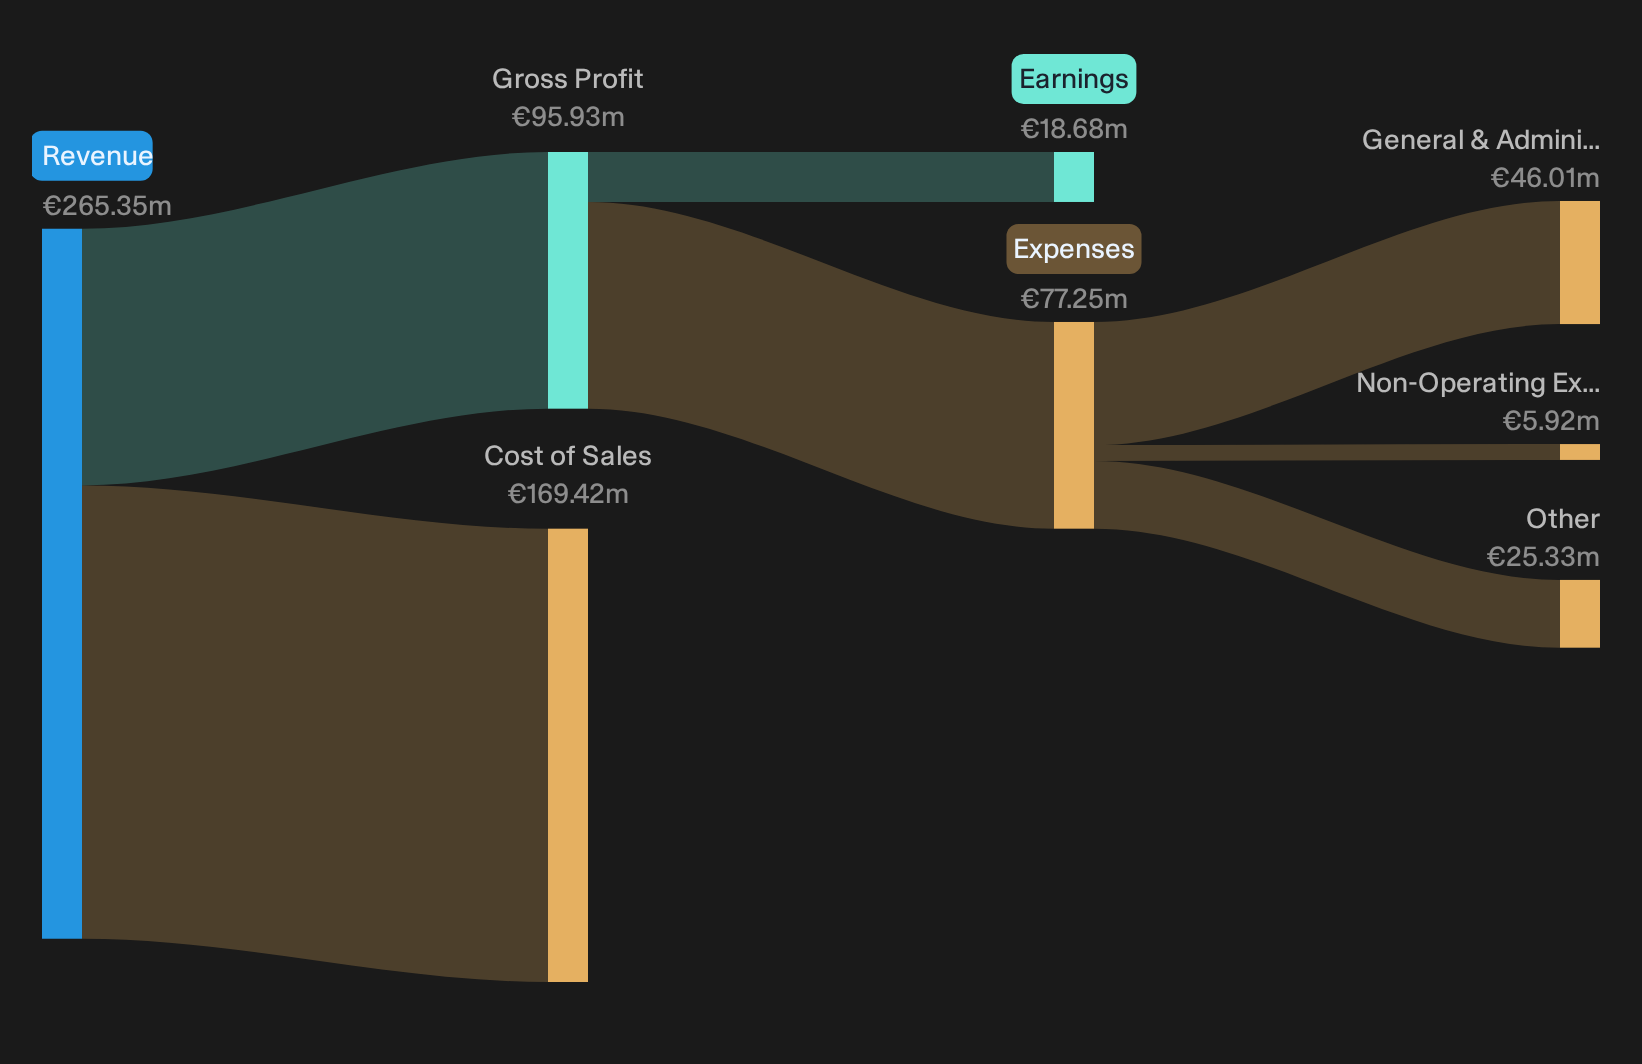
- Revenue (Q3 2026 vs. Q3 2025): €81.315 million vs. €53.877 million (up about 50.9%)
- Net Income (Q3 2026 vs. Q3 2025): €6.881 million vs. €4.254 million (up about 61.7%)
- Basic EPS (Q3 2026 vs. Q3 2025): €0.23 vs. €0.14 (up about 63.3%)
- Net Profit Margin, trailing 12 months: 7.0% vs. 7.6% a year earlier (indicating slightly lower profitability in recent results)
Ask Charlie what makes Incap’s growth look undervalued.
Incap Oyj: Testing The Bull Case Milestones
Bullish investors argue that Incap Oyj is methodically building a higher value manufacturing platform rather than just chasing volume.
"Ongoing investments in clean rooms in Slovakia, SMT and testing in India, and conformal coating in Estonia expand the service offering, which can help win more complex projects and support both revenue growth and net margin over time."
The latest quarter shows part of that blueprint coming through. Revenue of €81.315 million and basic EPS of €0.23 sit alongside a 7.0% trailing net margin that is slightly below 7.6% a year earlier. The capacity build and capability upgrades are visible, but the margin uplift case is not yet evidenced in the reported profitability.
The price and this Narrative do not agree. → Uncover what this Narrative says Incap Oyj is actually worth.
Bear Case Check: Incap Oyj’s Cost And Mix Friction
The bearish view argues that Incap Oyj’s recent expansion and M&A mix shift load the cost base faster than earnings can absorb.
"Ongoing investments in clean room facilities, SMT and testing capacity, coating capabilities and ISO 27001 certification across multiple sites increase depreciation and operating expenses. This may offset part of the revenue contribution from these projects and restrict improvement in EBITDA margin and net income."
The latest print shows revenue and EPS moving up together, yet the trailing 12 month net margin edging from 7.6% to 7.0%. That slippage indicates incremental projects and integration costs are still biting, so the concern about muted operating leverage remains unresolved rather than disproved.
Hunt Quiet Fundamental Dislocations
Incap Oyj just posted results that give investors updated figures to compare with its current valuation. The real opportunity is to research stocks that could be undervalued before the market closes those gaps.
- Company 1 - 41% below our estimate - expands contract-backed sensing and tracking hardware into new product add-ons and bolt-on acquisitions.
- Company 2 - 50% below our estimate - increases exposure to higher grade ore bodies as new underground projects, mine plans and technical reports progress.
- Company 3 - 27% below our estimate - sells photonic equipment feeding new semiconductor capacity and medical devices as order books recover from prior softness.
Three companies from the same screener. Open every one of the 201 undervalued companies on it →
Have feedback on this article? Concerned about the content? Get in touch with us directly. Alternatively, email editorial-team@simplywallst.com