


Gorman-Rupp (GRC) paired a stronger third quarter with a higher payout. The manufacturer reported higher year-over-year sales and earnings, along with a 5.3% increase in its quarterly dividend.
That combination of stronger earnings and a higher dividend has arrived after a powerful run in Gorman-Rupp’s stock, with a year-to-date share price return of 54.53% and a 1-year total shareholder return of 68.11%. However, the 90-day share price return is down 8.38%, suggesting some recent momentum has cooled following a strong multi-year total shareholder return of 159.00% over three years.
Capitalize on Gorman-Rupp’s earnings and dividend momentum by scanning a curated 7 dividend fortresses that share a similar focus on consistent cash payouts.Bulls point to Gorman-Rupp’s strong earnings and long dividend track record. Bears flag the sharp multi-year run and recent pullback. Which side does the current valuation appear to support?
Price-to-Earnings of 26.6x: Is it justified for Gorman-Rupp?
On recent numbers, Gorman-Rupp trades at a P/E of 26.6x. This lines up as cheaper than selected peers on earnings but richer than its broader Machinery industry and an estimated fair level.
The P/E ratio compares the company’s share price with its earnings per share. For a manufacturer like Gorman-Rupp, it gives a quick sense of how much investors are paying today for each dollar of current profits in a relatively mature industrial context.
Against a peer average P/E of 35.8x, Gorman-Rupp’s 26.6x mark looks restrained. This suggests the market is not paying a premium for its earnings record. Relative to the estimated fair P/E of 18x, the current multiple is materially higher, which points to a level the valuation could drift toward if expectations cool.
Compared with the wider US Machinery industry average of 24.4x, Gorman-Rupp’s 26.6x valuation is clearly richer. This implies investors are assigning a higher tag to its profit profile than they are to the sector overall.
Explore the SWS fair ratio for Gorman-Rupp.
Result: Price-to-Earnings of 26.6x (OVERVALUED)
Still, a sharp three year total return of 158.9969% and a recent 8.3754% pullback could leave Gorman-Rupp exposed if earnings or pump demand soften.
Find out about the key risks to this Gorman-Rupp narrative.
Another View: What Gorman-Rupp Looks Like On Cash Flows
The multiple suggests that Gorman-Rupp appears expensive, yet our DCF model points in the opposite direction. On that approach, the shares at $74.39 sit well below an estimated future cash flow value of $118.44, which indicates potential upside if those assumptions hold. When the signals conflict, it raises the question of which lens to rely on more.
Look into how the SWS DCF model arrives at its fair value.
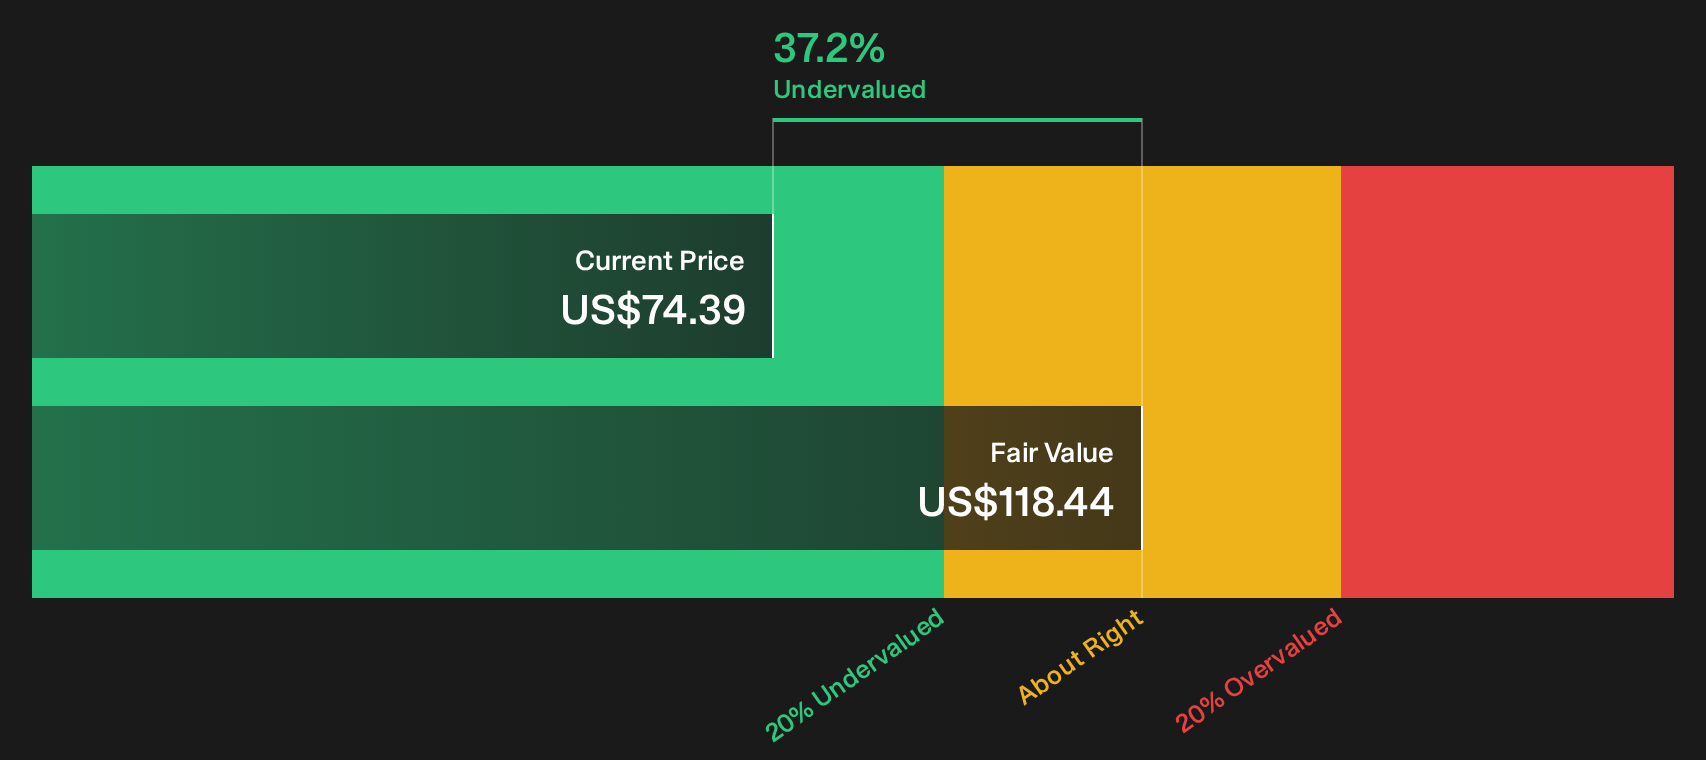
Simply Wall St performs a discounted cash flow (DCF) on every stock in the world every day (check out Gorman-Rupp for example). We show the entire calculation in full. You can track the result in your watchlist or portfolio and be alerted when this changes, or use our stock screener to discover 30 high quality undervalued stocks. If you save a screener we even alert you when new companies match - so you never miss a potential opportunity.
Next Steps
Mixed messages or clear signal? Either way, move quickly to check the underlying numbers, weigh both the upside and the red flags, then judge Gorman-Rupp for yourself with the 3 key rewards and 2 important warning signs
Looking for more investment ideas beyond Gorman-Rupp?
If Gorman-Rupp has caught your attention, do not stop at one ticker. Use the broader toolkit to pressure test ideas and uncover fresh opportunities.
- Target resilience by scanning companies with stronger financial buffers using the list of solid balance sheet and fundamentals (23 results).
- Hunt for better value by reviewing a curated 30 high quality undervalued stocks that may trade at more modest earnings and cash flow multiples.
- Lock in income potential by comparing payout-focused stocks through a dedicated 7 dividend fortresses.
Have feedback on this article? Concerned about the content? Get in touch with us directly. Alternatively, email editorial-team@simplywallst.com