


MISUMI Group (TSE:9962) has called a board meeting for 30 October 2026 to review a planned announcement on revising its consolidated business forecast, putting potential changes to the company’s financial outlook in focus for investors.
Recent trading suggests investors have been pricing in higher expectations for MISUMI Group, with a 56.69% year to date share price return and a 66.13% 1 year total shareholder return. However, the 5 year total shareholder return is down 15.02%, hinting that momentum is relatively recent rather than long established.
Scan beyond MISUMI Group and see how other factory automation and industrial suppliers are setting up for their next move with our hand-picked 96 robotics and automation stocks.
After a near 67% 1 year return and a board meeting focused on revising forecasts, MISUMI Group now asks a harder question for investors: Does the current price still leave enough upside to justify the risk?
Preferred P/E of 23x for MISUMI Group: Is it justified?
On simple numbers, MISUMI Group trades on a P/E of 23x, which looks rich next to both its peer group and the wider JP Machinery industry. The last close at ¥3,925 sits well below some valuation models, yet the earnings multiple still asks investors to pay up for each yen of profit.
The P/E ratio compares the current share price with earnings per share and gives a quick sense of how much you are paying for current profits. For a factory automation and components supplier like MISUMI Group, this matters because earnings can be cyclical and investors often look at P/E to judge whether they are paying a premium for growth that may or may not materialise.
In this case, MISUMI Group carries a P/E of 23x compared with the estimated fair P/E of 21x. That suggests the market is applying a higher valuation than the level some models indicate the stock could settle toward. Against the JP Machinery industry average P/E of 12.5x and a peer average of 18x, the current tag looks punchy and signals that buyers are already assigning a higher value to its forecast growth profile.
Explore the SWS fair ratio for MISUMI Group.
Result: Price-to-earnings of 23x (OVERVALUED)
Still, MISUMI Group relies heavily on demand for factory automation gear and die components, so any slowdown in customer capital spending or pricing pressure could quickly challenge the current optimism.
Find out about the key risks to this MISUMI Group narrative.
Another view on MISUMI Group’s value
The picture changes once the SWS DCF model is brought in. On that basis, MISUMI Group at ¥3,925 is below an estimated future cash flow value of ¥6,553.3, which points to an undervalued stock where cash generation suggests more support than the 23x P/E alone implies. So which signal should carry more weight for you?
Look into how the SWS DCF model arrives at its fair value.
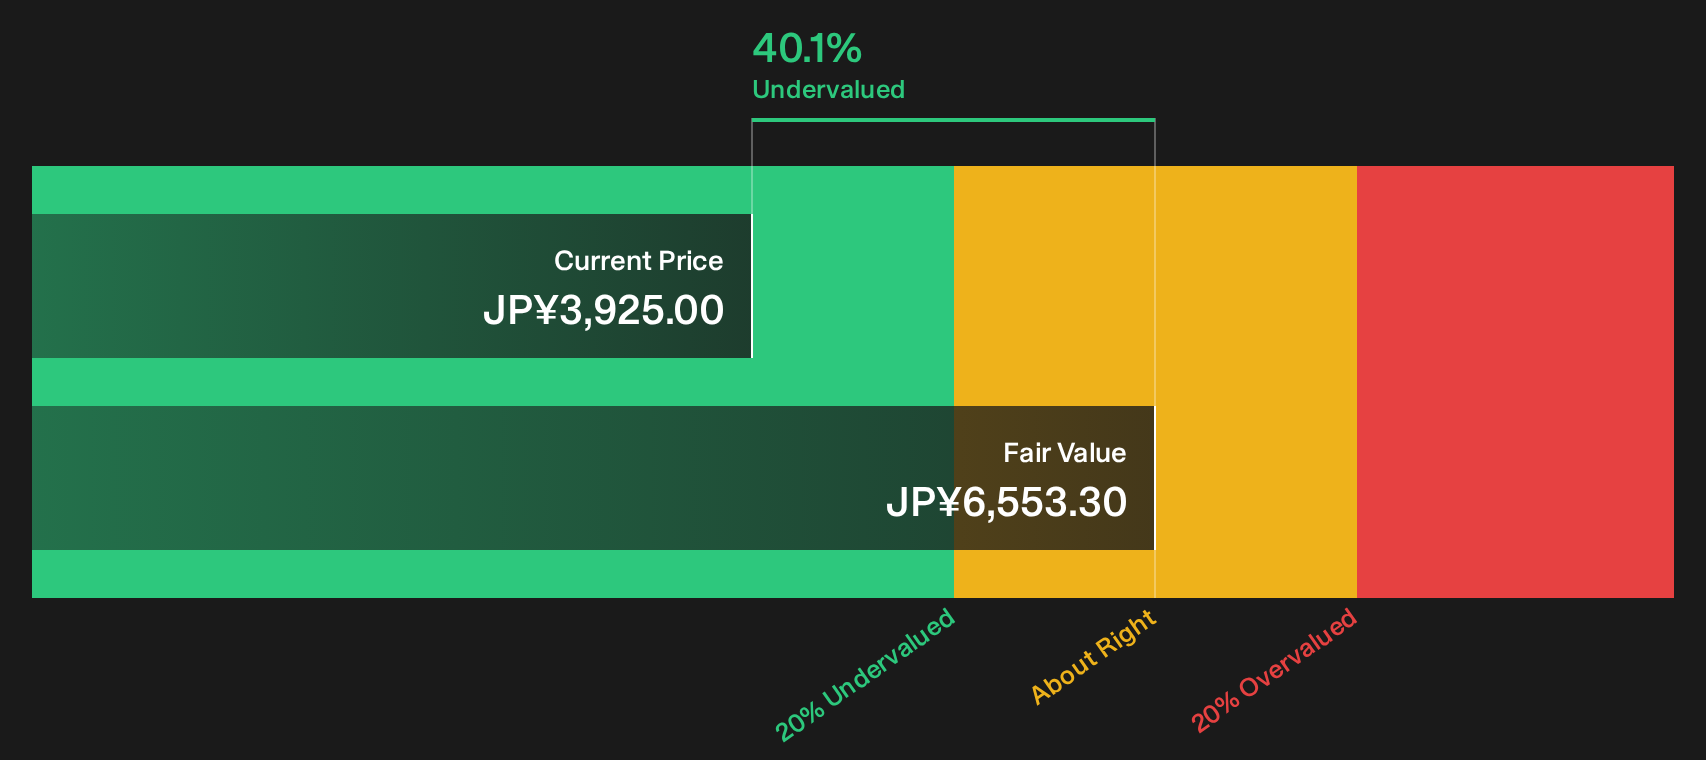
Simply Wall St performs a discounted cash flow (DCF) on every stock in the world every day (check out MISUMI Group for example). We show the entire calculation in full. You can track the result in your watchlist or portfolio and be alerted when this changes, or use our stock screener to discover 15 high quality undervalued stocks. If you save a screener we even alert you when new companies match - so you never miss a potential opportunity.
Next Steps
With MISUMI Group sending mixed valuation signals, it helps to move fast, inspect the full picture and decide where you stand. To balance the optimism against the concerns, run through the 3 key rewards and 1 important warning sign
Looking for more investment ideas beyond MISUMI Group?
If MISUMI Group has raised your interest, do not stop at a single opportunity. Broaden your watchlist now so you are not late to the next setup.
- Target potential upside with focused ideas by scanning the market for 71 high quality undiscovered gems.
- Strengthen your downside protection by zeroing in on companies with resilient finances through a list of solid balance sheet and fundamentals (22 results).
- Stack your income options by reviewing a curated set of reliable payers across our 27 dividend fortresses.
Have feedback on this article? Concerned about the content? Get in touch with us directly. Alternatively, email editorial-team@simplywallst.com