


Kagome (TSE:2811) caught investors' attention after declaring an annual dividend of ¥58.00 per share, scheduled for payment on March 5, 2027, to coincide with its upcoming Q3 2026 earnings report.
Recent trading suggests Kagome’s momentum is steady rather than explosive, with a 30-day share price return of 3.77% and a 90-day gain of 4.92% at a latest share price of ¥2,738.5. The 1-year total shareholder return of 4.77% contrasts with a weaker 3-year total shareholder return that declined 8.36%, which may indicate that the higher dividend is drawing renewed attention after a softer longer-term run.
Scan for other income ideas around Kagome’s dividend move by checking our hand picked list of 27 dividend fortresses that combine yield with robust underlying businesses.
For Kagome, the richer dividend and solid recent share gains leave a sharper question. Is most of the easy upside already priced in, or do the fundamentals still point to value on the table?
Preferred P/E of 18.6x: Is it justified?
Kagome trades on a P/E of 18.6x while our fair P/E estimate sits lower at 16.7x, which suggests investors are paying a premium to recent earnings even as the shares change hands at ¥2,738.5.
The P/E ratio compares the current share price with earnings per share and gives a rough sense of how much you are paying for each unit of profit. For a food and beverage group like Kagome, this metric often reflects how durable investors think those profits are and how much earnings expansion they are willing to pay for.
Earnings quality is flagged as high and profit has grown by 15% per year over the past 5 years, yet the most recent year showed a decline of 0.9% and net profit margins slipped from 4.5% to 4.4%. That mix of solid multi year progress with softer near term trends can help explain why the market assigns a richer multiple than the 16.7x level that our fair ratio suggests.
Compared with peers, Kagome screens as good value versus the broader peer average P/E of 21.3x, but looks expensive relative to the JP Food industry average of 16.4x. That split points to investors giving the stock more credit than the industry baseline while still paying less than for the wider peer set, which is consistent with a market view that the current earnings stream is dependable but not aggressively growing.
Explore the SWS fair ratio for Kagome.
Result: Price-to-earnings of 18.6x (OVERVALUED)
Still, Kagome faces pressure if revenue growth of 1.9% and net income growth of 2.8% fail to support its richer 18.6x P/E premium.
Find out about the key risks to this Kagome narrative.
Another View: Kagome Through A Cash Flow Lens
The earnings multiple paints Kagome as slightly pricey, yet the SWS DCF model hints at a very different story. On that measure, the shares at ¥2,738.5 screen as undervalued relative to an estimated future cash flow value of ¥3,888.58. Which signal deserves more weight in your process?
Look into how the SWS DCF model arrives at its fair value.
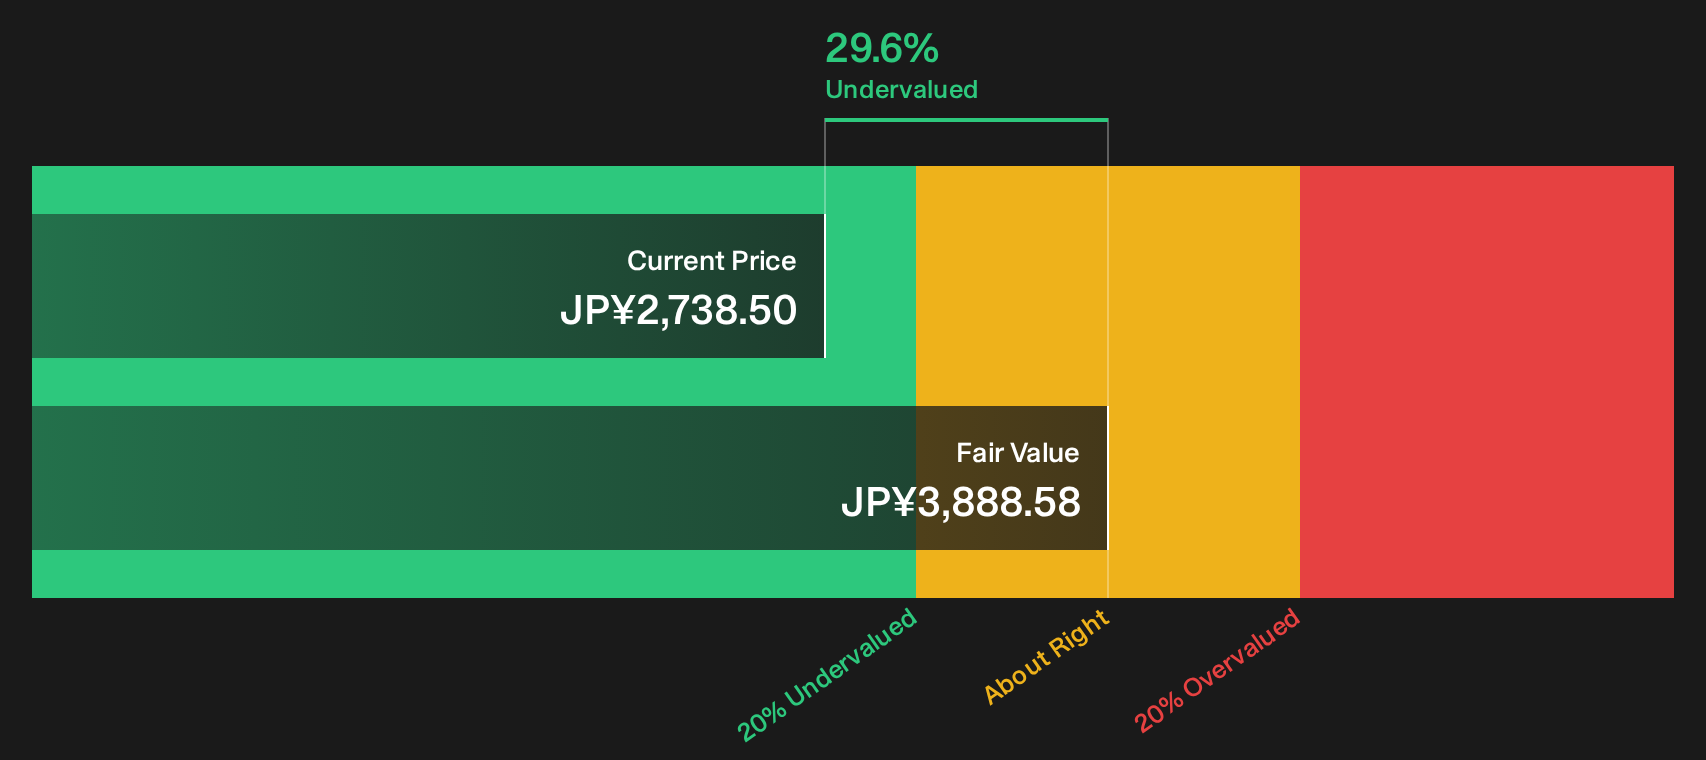
Simply Wall St performs a discounted cash flow (DCF) on every stock in the world every day (check out Kagome for example). We show the entire calculation in full. You can track the result in your watchlist or portfolio and be alerted when this changes, or use our stock screener to discover 15 high quality undervalued stocks. If you save a screener we even alert you when new companies match - so you never miss a potential opportunity.
Next Steps
With sentiment this mixed around Kagome, it helps to move quickly and test the assumptions against your own process and time horizon. To understand why some investors still see reasons for optimism, take a closer look at the 3 key rewards
Looking for more investment ideas beyond Kagome?
If Kagome has sharpened your focus on quality and valuation, do not stop here. Broader opportunities often emerge where fewer investors are currently looking.
- Target resilient balance sheets and steady fundamentals by scanning our list of solid balance sheet and fundamentals (22 results) to keep financial strength front and center.
- Hunt for potential mispricings by filtering through a 15 high quality undervalued stocks that combines quality fundamentals with appealing valuations.
- Lock in income ideas early by reviewing a 27 dividend fortresses before yield focused investors crowd in.
Have feedback on this article? Concerned about the content? Get in touch with us directly. Alternatively, email editorial-team@simplywallst.com