


Figma stock reaction and recent performance
Figma (FIG) drew fresh attention after recent trading left the stock around $21.65, prompting investors to reassess a business that reports annual revenue of about $1.28b alongside a net loss of roughly $1.53b.
Recent trading has been choppy for Figma, with the share price falling about 3% in the last session and down roughly 12% over the past week. The year-to-date share price return of about 42% in decline and a 1-year total shareholder return of around 57% in decline point to momentum that has been fading rather than building.
Contrast Figma's slide with other software players by scanning our hand picked 41 profitable AI stocks that aren't just burning cash that pair revenue growth with stronger bottom lines.
Figma now trades well below its recent highs after a sharp pullback, raising a blunt question: Are investors reassessing the fundamentals, or just resetting sentiment as valuations come under closer scrutiny?
Most Popular Narrative: 3% Undervalued
Figma is priced at $21.65 against a widely followed fair value estimate of about $22.36, which implies a small discount that hinges on how convincingly the platform can convert its product reach into durable economics.
The moat is not that Figma has every individual feature. It is that design, code, collaboration, company context and now agents can all live in the same environment.
Figma is not only expanding what existing designers can do; it is expanding who the product is for.
See why 65 investors see Figma as 3% undervalued.
Result: Fair Value of $22.36 (UNDERVALUED)
Still, Figma’s narrative can break if heavy AI and product spending keeps widening losses, or if deep pocketed rivals narrow its collaboration and ecosystem edge.
Find out about the key risks to this Figma narrative.
Another view on Figma’s valuation
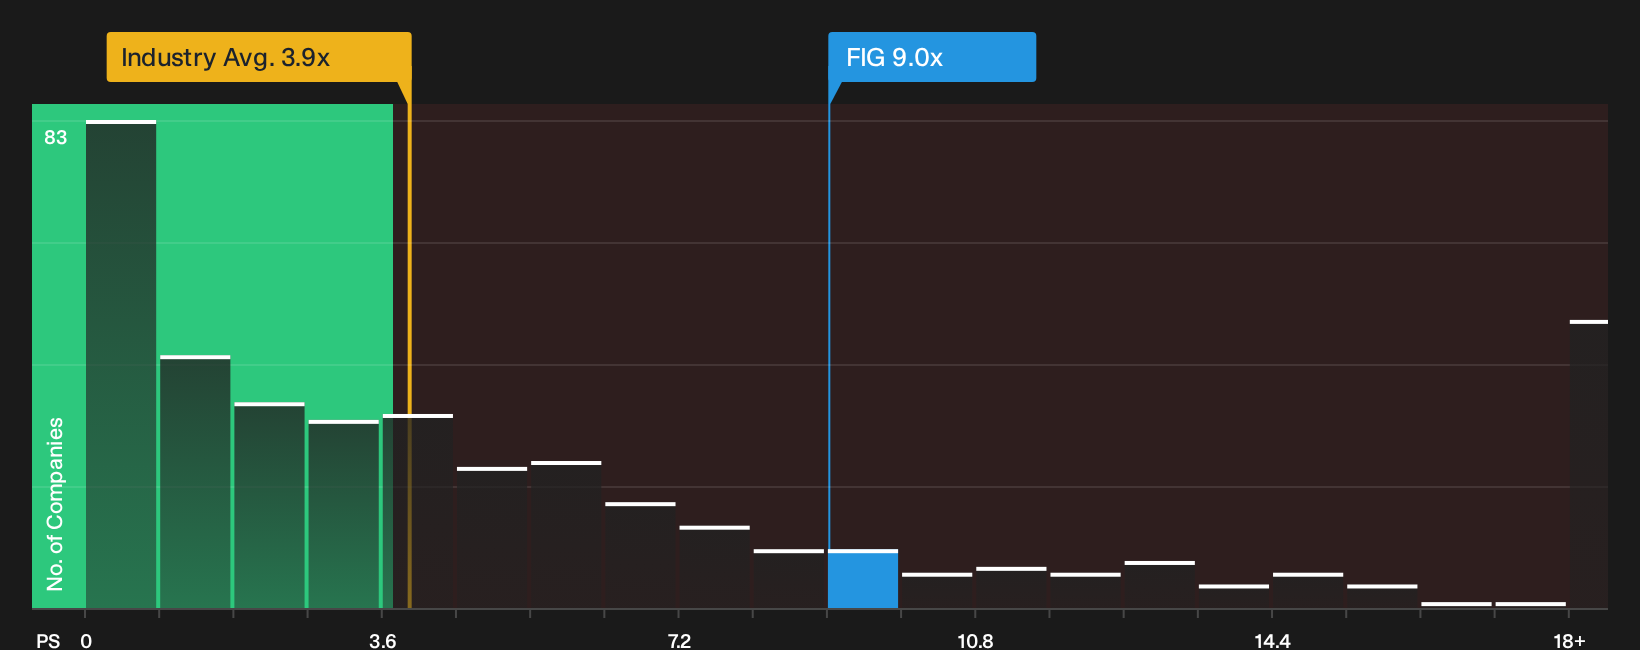
While the narrative fair value of Figma points to a small discount at $22.36, the market’s own yardstick tells a different story. At a P/S ratio of 9x, FIG trades far above the US Software industry on 3.9x and peers on 8.5x, and even above its fair ratio of 8.6x. That gap suggests investors are already paying upfront for strong execution, which raises the question of how much mispricing is really left on the table.
For a closer look at what this pricing gap could mean in practice, including how the fair ratio might act as a reference point if sentiment cools, See what the numbers say about this price — find out in our valuation breakdown..
Next Steps
If this mixed picture around Figma leaves you on the fence, act quickly and weigh the trade off between its risks and potential upside yourself. A good place to start is by lining up the 4 key rewards and 3 important warning signs.
Looking for more investment ideas beyond Figma?
Do not stop with one ticker. Broaden your watchlist using focused stock ideas so you can compare Figma against other opportunities that might suit your approach.
- Target stability first by scanning a list of solid balance sheet and fundamentals (24 results) that prioritises resilient finances and cleaner balance sheets.
- Chase upside where quality meets value by reviewing a 19 high quality undiscovered gems that combines strong fundamentals with lower market attention.
- Prioritise sleep at night holdings by using a 29 resilient stocks with low risk scores that filters for businesses with more measured risk profiles.
Have feedback on this article? Concerned about the content? Get in touch with us directly. Alternatively, email editorial-team@simplywallst.com