


Why Union Pacific’s latest earnings matter for shareholders
Union Pacific (UNP) just released third quarter results that showed higher revenue, net income, and earnings per share versus a year earlier, and management backed its outlook for high single digit EPS growth for 2026.
Union Pacific’s recent earnings update comes after a strong run for the stock, with a year-to-date share price return of 31.09% and a 1-year total shareholder return of 41.85%. This builds on multi-year gains, including a 3-year total shareholder return of 52.40%.
Compare Union Pacific’s momentum and earnings profile with a hand picked group of rail and industrial peers by screening for 29 resilient stocks with low risk scores that may better fit your risk tolerance.
The shares now trade at a discount to the average analyst price target after a strong run. This puts the spotlight on Union Pacific’s valuation and whether the market’s caution still holds up.
Most Popular Narrative: 7.8% Undervalued
Union Pacific’s most followed valuation story pins fair value at $329.88 versus the latest close of $304, which puts recent earnings into the context of a stock that some investors see as modestly mispriced.
The proposed merger with Norfolk Southern, including targeted annual revenue synergies of US$1.8b and cost synergies of US$1b and a plan to resume share repurchases by year 2 after closing, would materially reshape the network footprint and could lift long term earnings and cash flow if executed as outlined.
See why 92 investors see Union Pacific as 8% undervalued.
Result: Fair Value of $329.88 (UNDERVALUED)
Still, the bullish Union Pacific thesis leans heavily on the smooth approval of the Norfolk Southern merger and on fuel and wage costs not eroding those modeled margins.
Find out about the key risks to this Union Pacific narrative.
Another View: Union Pacific Through Cash Flows
There is a different take on Union Pacific when the SWS DCF model is used. On this approach, the stock at $304 screens as expensive versus an estimated future cash flow value of $258. This tilts the story toward overvaluation and raises the question of which yardstick you trust more.
If you want to see how each input in that cash flow model affects the gap between $304 and $258, Look into how the SWS DCF model arrives at its fair value.
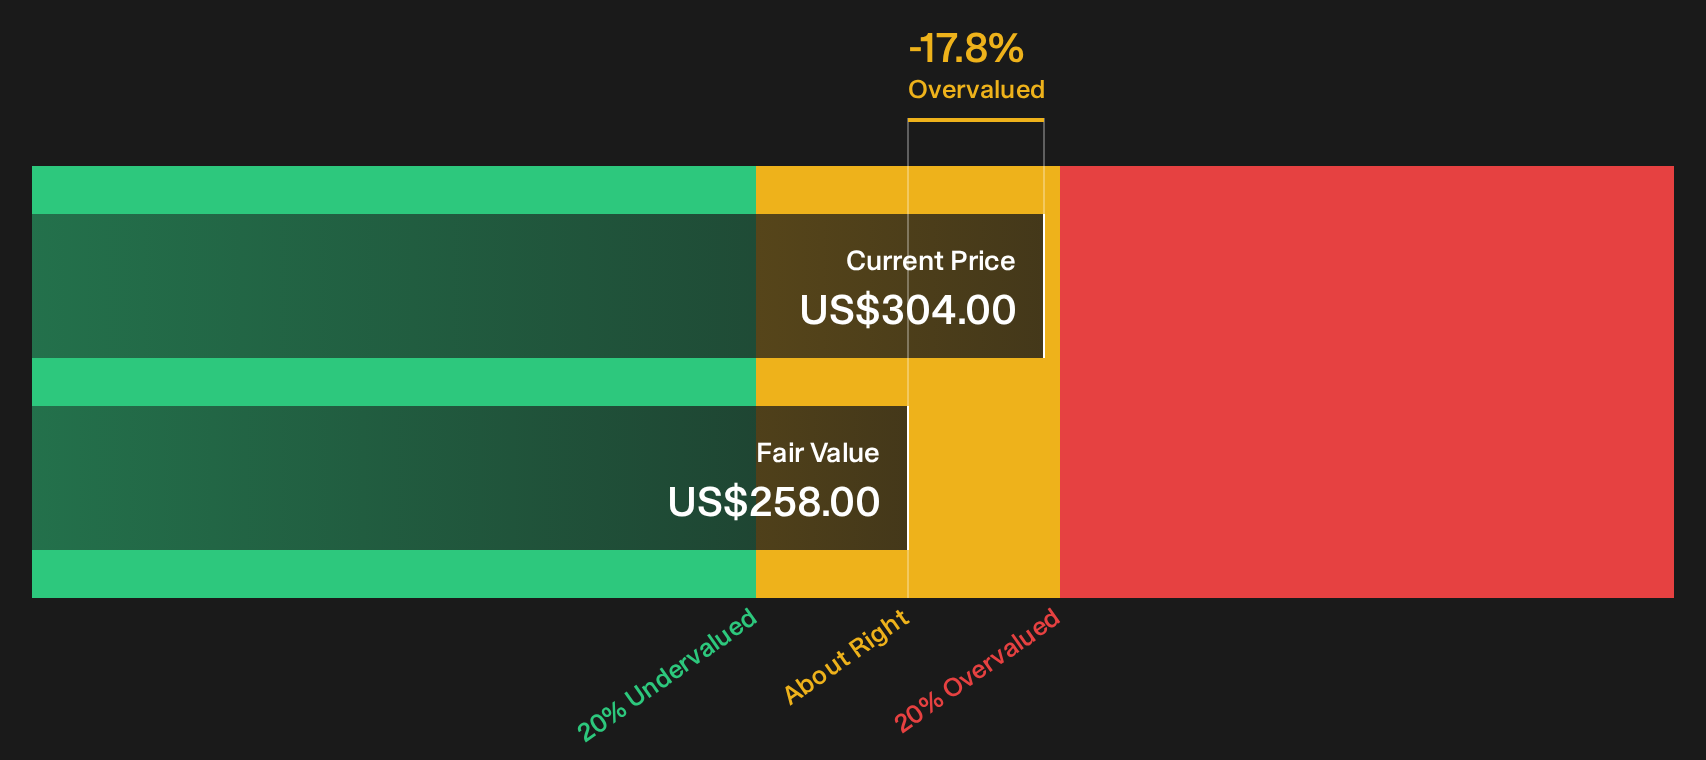
Simply Wall St performs a discounted cash flow (DCF) on every stock in the world every day (check out Union Pacific for example). We show the entire calculation in full. You can track the result in your watchlist or portfolio and be alerted when this changes, or use our stock screener to discover 36 high quality undervalued stocks. If you save a screener we even alert you when new companies match - so you never miss a potential opportunity.
Next Steps
Mixed messages on valuation and growth can pull investors in different directions, so move sooner rather than later to stress test your own view using the 4 key rewards and 1 important warning sign.
Looking for more Union Pacific investment ideas?
If Union Pacific already plays a role in your portfolio, treat this as a starting point and keep searching for fresh opportunities that match your goals and risk comfort.
- Target resilient compounding by reviewing a 5 dividend fortresses that aims to pair higher yields with balance sheet strength and consistent cash generation.
- Hunt for mispriced quality by scanning a 19 high quality undiscovered gems that screens for solid fundamentals the broader market may be ignoring.
- Prioritise capital preservation by focusing on a list of solid balance sheet and fundamentals (24 results) that filters for firms with sturdier finances and fewer balance sheet surprises.
Have feedback on this article? Concerned about the content? Get in touch with us directly. Alternatively, email editorial-team@simplywallst.com