


TriNet Group (TNET) just posted third quarter results that combined softer revenue with firmer profitability, as lower worksite employee volumes weighed on sales while insurance performance and reaffirmed full year guidance underlined management confidence.
The mixed third quarter message has fed into a choppy share price pattern for TriNet Group, with the 7 day share price return down 14.6% but the year to date share price return still up 12.4% and the 1 year total shareholder return at 9.6%. However, the 3 and 5 year total shareholder returns, both down more than 35%, point to longer term momentum that has been fading even as recent guidance and profitability shape how investors weigh both risk and valuation today.
Seize this chance to compare TriNet Group's risk and valuation profile against a curated 36 high quality undervalued stocks that may be pricing in sturdier earnings resilience than recent headlines suggest.Bulls point to firmer profit guidance and improving insurance metrics at TriNet Group. Bears focus on softer revenue and a sliding multi year return record. Which story does the current valuation actually support?
Most Popular Narrative: 3% Undervalued
TriNet Group closed at $64.28 compared with a widely followed fair value estimate of $66.20, leaving a small valuation gap that depends on execution in HR outsourcing, AI tools, and distribution build out.
The increasing complexity of workforce regulations and compliance requirements is expected to drive higher demand for TriNet Group's outsourced HR services, which can support client retention and long term recurring revenue growth.
The acceleration in SMB adoption of remote and hybrid work models is pushing more businesses to seek flexible PEO solutions, which can expand TriNet Group's addressable market and lift customer acquisition and overall revenues.
See why 1 investors see TriNet Group as 3% undervalued.
Result: Fair Value of $66.20 (UNDERVALUED)
Still, the narrative wobbles if worksite employee volumes keep sliding, or if health cost trends stay elevated and pressure TriNet Group’s insurance margins.
Find out about the key risks to this TriNet Group narrative.
Another View: TriNet Group Through The P/E Lens
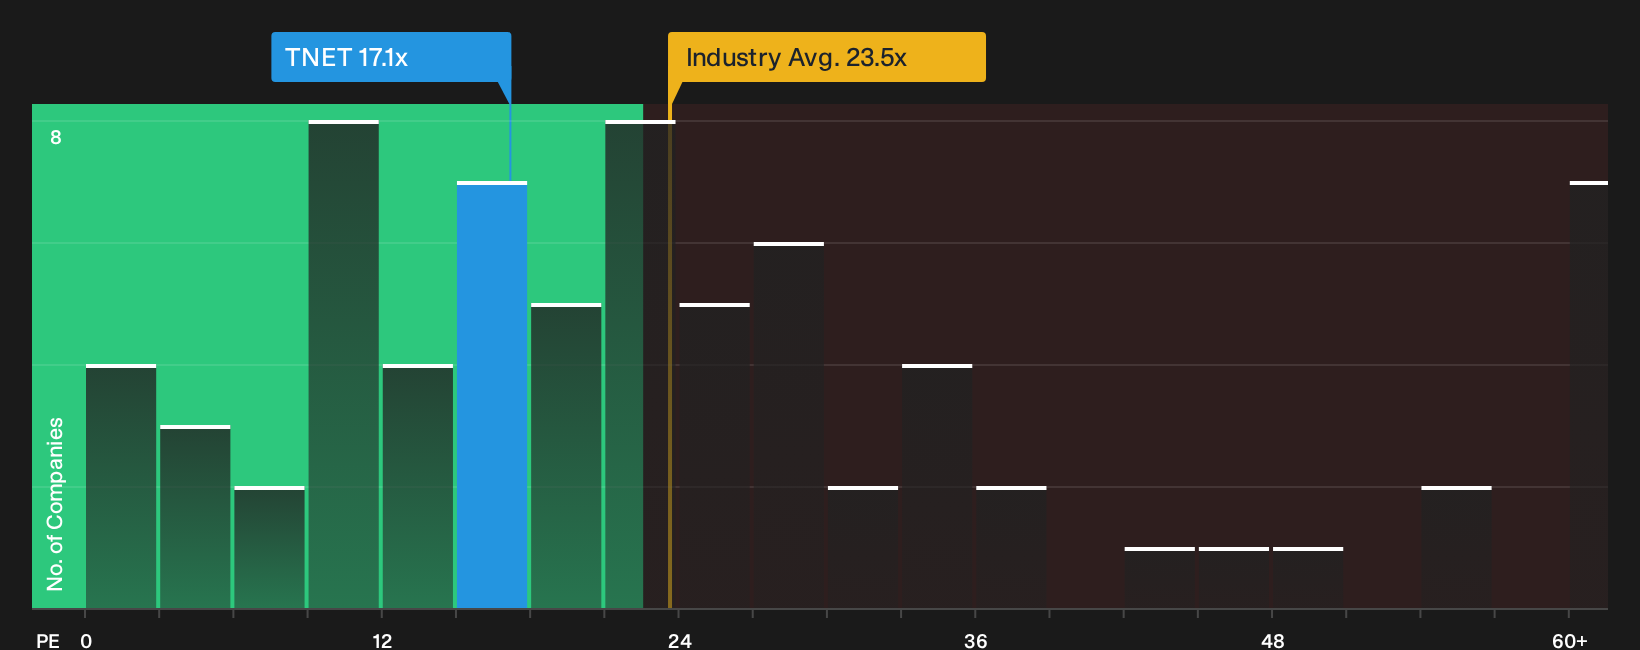
TriNet Group looks inexpensive on a simple P/E check. The stock trades on 17.1x earnings compared with a fair ratio of 16x, while the US Professional Services industry sits at 23.5x and peer companies average 54.2x. That gap can signal either opportunity or quality concerns. Which side do you think it reflects?
To test that simple earnings multiple against a deeper valuation, take a look at the See what the numbers say about this price — find out in our valuation breakdown..
Next Steps
Mixed headlines around TriNet Group can pull you in either direction, so move quickly and test the numbers yourself, then weigh the 3 key rewards and 2 important warning signs.
Looking for more investment ideas beyond TriNet Group?
Do not stop with TriNet Group. Use fresh data, clear filters, and side by side comparisons to uncover opportunities that better match your risk and return priorities.
- Target potential mispricings by scanning a curated pool of financially strong businesses through the 36 high quality undervalued stocks.
- Build income-focused watchlists by zeroing in on robust cash generators with the 5 dividend fortresses.
- Reduce portfolio stress by concentrating on sturdy companies that pass strict balance sheet checks using the list of solid balance sheet and fundamentals (24 results).
Have feedback on this article? Concerned about the content? Get in touch with us directly. Alternatively, email editorial-team@simplywallst.com