


Universal Display (OLED) just put fresh numbers and guidance on the table, with Q3 2026 results, a reiterated full year revenue outlook, and ongoing capital returns through dividends and buybacks drawing investor attention.
The fresh guidance and capital return moves come against a mixed share price backdrop for Universal Display. The stock trades at US$89.40, with a 30 day share price return of 11.24% pointing to building momentum. However, the year to date share price return declined 26.63% and the 1 year total shareholder return declined 35.75%. This reflects how recent optimism around OLEDX, phosphorescent blue progress and the latest buyback sits against a tougher multi year journey for long term holders.
Scan how Universal Display compares with other OLED and semiconductor plays by reviewing our curated list of 53 AI infrastructure stocks in the current upgrade and guidance cycle.
Universal Display has already clawed back some ground, yet the share price is still well below where it started the year. Is the recent jump a small step in a longer rerating, or was most of the upside just spent?
Most Popular Narrative: 23% Undervalued
Universal Display's most followed narrative pins fair value at $115.37, well above the last close of $89.40. This frames the current rebound as only a partial catch up to that valuation anchor based on a discount rate of 11.28%.
Ongoing investments from major panel makers in new Gen 8.6 OLED fabs for IT displays, including four large projects across Samsung, BOE, Visionox and TCL China Star with roughly US$20b of committed capital and mass production at two of these already under way, point to future material volume growth that could support Universal Display revenue and scale benefits for margins.
See why 29 investors see Universal Display as 23% undervalued.
Result: Fair Value of $115.37 (UNDERVALUED)
Still, the refreshed story around Universal Display only holds if smartphone softness and the drop in OLED material sales do not deepen into a longer demand reset.
Find out about the key risks to this Universal Display narrative.
Another View: P/E Signals For Universal Display
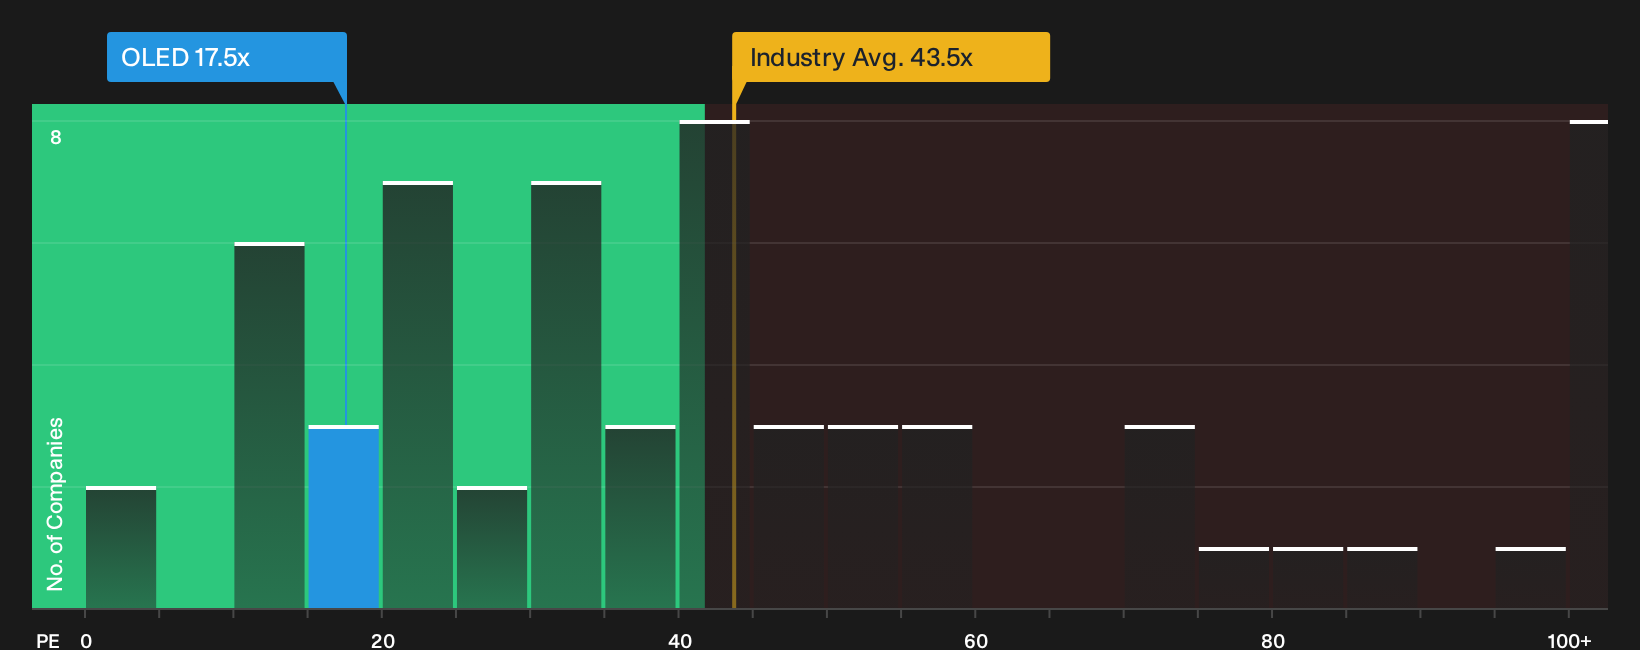
Universal Display looks very different when you move away from fair value estimates and focus on the plain P/E math. The shares trade on 17.5x earnings compared with 46x for peers and 41.7x for the wider US semiconductor group, while the fair ratio sits at 19x.
That gap points to a material valuation discount, yet the fair ratio also suggests some room for the multiple to drift higher if sentiment turns, or compress further if expectations reset. With such a wide spread between the stock, sector and that 19x fair ratio, which anchor do you trust most when you think about risk on the next leg?
See what the numbers say about this price — find out in our valuation breakdown.
Simply Wall St performs a discounted cash flow (DCF) on every stock in the world every day (check out Universal Display for example). We show the entire calculation in full. You can track the result in your watchlist or portfolio and be alerted when this changes, or use our stock screener to discover 35 high quality undervalued stocks. If you save a screener we even alert you when new companies match - so you never miss a potential opportunity.
Next Steps
Mixed signals on Universal Display can either look like confusion or opportunity depending on how you read the data in front of you, so act promptly and stress test the numbers yourself by weighing 4 key rewards and 1 important warning sign
Looking for more investment ideas beyond Universal Display?
If you stop at Universal Display, you risk missing other setups that might fit your goals even better, so put the Simply Wall St screener to work.
- Target resilient balance sheets and consistent fundamentals by scanning the list of solid balance sheet and fundamentals (23 results) that can help anchor your portfolio when sentiment swings.
- Hunt for mispriced opportunities by reviewing the 35 high quality undervalued stocks that combine stronger fundamentals with share prices that have not fully reflected them yet.
- Build a watchlist geared toward future potential by tracking the 19 high quality undiscovered gems that remain off most investors' radar today.
Have feedback on this article? Concerned about the content? Get in touch with us directly. Alternatively, email editorial-team@simplywallst.com