


The Zhitong Finance App learned that, according to preliminary statistics, the China Passenger Vehicle Market retailed 1.693 million vehicles from October 1 to 31, down 25% from the same period in October last year, up 5% from the same period last month, and sold 15.027 million vehicles, down 22% year on year; from October 1 to 31, passenger car manufacturers sold 2.635 million vehicles, down 10% from the same period last month, up 3% from the same period last month. Since this year, a total of 22.372 million vehicles have been sold, down 6% year on year.
From October 1 to 31, the national passenger car market retailed 1.148 million new energy vehicles, down 10% from the same period last month, up 6% from the same period last month, with cumulative retail sales of 8.907 million units since this year, down 12% year on year; from October 1 to 31, passenger car manufacturers across the country sold 1.807 million new energy vehicles, up 12% from the same period last month, up 8% from the same period last month, and a total of 13.256 million vehicles have been sold since this year, up 10% year on year.
Penetration rate: From October 1 to 31, the penetration rate of new energy retail sales in the national passenger car market was 67.8%; from October 1 to 31, the penetration rate of new energy wholesale by passenger car manufacturers nationwide was 68.6%.
Production: From the first to the fourth week of October, the country produced 386,000 pure fuel light vehicles, down 52% from the same period last year, and down 1% from the same period last month; overall hybrid and plug-in hybrid production in the first to fourth week of October was 397,000 units, down 21% from the same period last year, up 20% from the same period last month.
Retail sales trend in the national passenger car market in October 2026
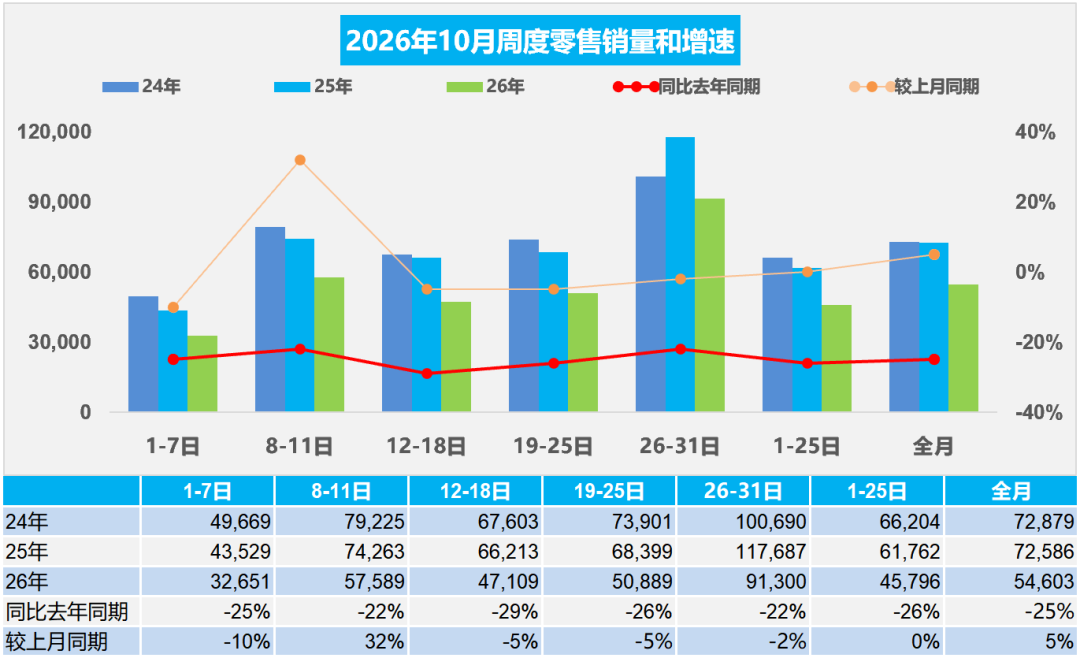
In the first week of October, the national passenger car market sold an average of 33,000 vehicles per day, down 25% from the same period in October last year, and down 10% from the same period last month.
In the second week of October, the national passenger car market sold an average of 58,000 vehicles per day, down 22% from the same period in October last year, and up 32% from the same period last month.
In the third week of October, the national passenger car market sold 47,000 vehicles per day, down 29% from the same period in October last year and 5% from the same period last month.
In the fourth week of October, the national passenger car market sold an average of 51,000 vehicles per day, down 26% from the same period last October and 5% from the same period last month.
In the fifth week of October, the national passenger car market sold an average of 91,000 vehicles per day, down 22% from the same period last October and 2% from the same period last month.
Preliminary statistics: From October 1 to 31, the national passenger car market retailed 1.693 million vehicles, down 25% from the same period in October last year, up 5% from the same period last month; since this year, 15.027 million units have been sold, down 22% year on year.
Since the Mid-Autumn Festival is in late September this year, during the traditional “gold nine silver ten” consumption season, the effective sales period in October was even longer, and terminal passenger traffic continued to pick up slightly.
International fuel prices continue to be high, vehicle costs are high, and fuel vehicle consumption exceeds expectations and is sluggish. The increase in consumer first purchases has been temporarily blocked, and replacement stocks have become an important support for steady growth. The high-end is already in the Red Sea, and the opportunities in the car market are the popularity of the middle and low end. Due to recent weak sales performance in the North and Midwest, the fuel vehicle base that rebounded in October has been damaged. It is difficult for retail sales to strengthen in the winter that began in October, and the desire to reserve stocks early is not strong.
The increase in the car market in October was driven by factors such as the National Day Auto Show, local subsidies, and peak season promotions for car companies. The recovery in the car market was relatively moderate. Early industry public opinion events were negative, or caused new doubts and waits among users about the overall confidence of new energy products, which is not conducive to promoting transactions. Recently, there has been a slight improvement.
Wholesale sales trend of national passenger car manufacturers in October 2026
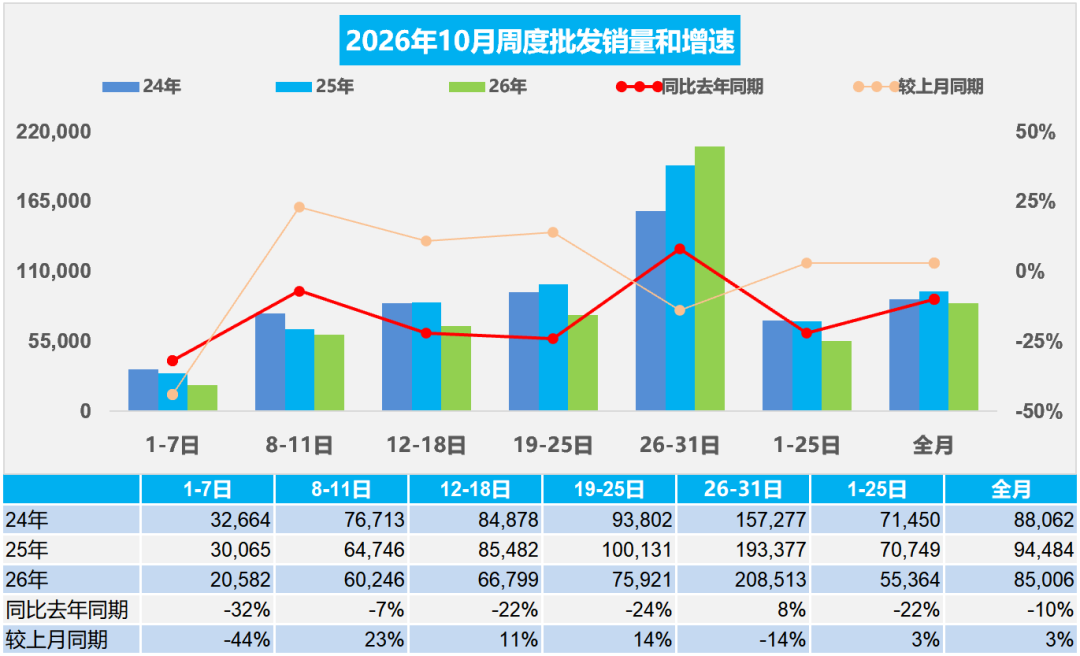
In the first week of October, passenger car manufacturers across the country sold 21,000 vehicles per day, down 32% from the same period last October and 44% from the same period last month.
In the second week of October, passenger car manufacturers across the country sold an average of 60,000 vehicles per day, down 7% from the same period in October last year, and up 23% from the same period last month.
In the third week of October, passenger car manufacturers across the country sold 67,000 vehicles per day, a decrease of 22% compared to the same period in October last year, and an increase of 11% over the same period last month.
In the fourth week of October, passenger car manufacturers across the country sold 76,000 vehicles per day, down 24% from the same period in October last year, and up 14% from the same period last month.
In the fifth week of October, passenger car manufacturers across the country sold 209,000 vehicles per day, an increase of 8% over the same period in October last year, and a decrease of 14% over the same period last month.
Preliminary statistics: From October 1 to 31, passenger car manufacturers across the country sold 2.635 million vehicles, down 10% from the same period in October last year, and up 3% from the same period last month; since this year, a total of 22.372 million vehicles have been sold, down 6% year on year.
In previous years, the “Golden Nine and Silver Ten” fuel vehicles were able to get the cake. This year, the peak winter sales period has weakened dramatically under high fuel prices. High fuel prices have led to an overall downturn in manufacturers' sales. Wholesale sales of fuel vehicle manufacturers fell 52% in the first four weeks. Due to the continued sharp decline in fuel vehicle retail sales, domestic demand for fuel vehicles production declined significantly in October as seen from environmental data. Most NEV brands currently lack popular models, but manufacturers also need a stable production pace. As a huge industrial chain system, it is impossible to simply schedule production according to orders, and production and sales targets must also be considered, so there is a big gap between external estimated order data and the actual sales of the company. Recently, the price of lithium carbonate has dropped dramatically, which is beneficial to the price reduction on the battery side. Along with the adjustment trend of NEV export tax rebates, and increased export trade restrictions next year, it is conducive to improving NEV export grabbing in the fourth quarter.
From January to September 2026, China accounts for 32% of the world's automobile share
According to World Automobile Organization statistics, global automobile production continues to grow, reaching 96.89 million vehicles in 2025, up 6% from 91.77 million vehicles in 2024, and China accounts for 35.4% of world production. From January to September 2026, the world's automobile sales volume was 72.52 million units, up 3% year on year; of these, sales volume in September was 8.74 million units, up only 2% year on year, up 12.4% month on month, and the growth momentum of the global car market was weak.
From January to September 2026, the cumulative global automobile sales volume was 72.52 million units. By country, China sold 23.27 million vehicles, with a share of 32.1%, a marked drop from 35.4% in 2025; the US sold 12.3 million units, with a share of 17.0%, a slight decline; and India performed well, increasing its share to 6.7%, becoming a highlight of growth. Judging from changes in share over the years, China's share of the world continued to rise from 2022 to 2025, and reached a phased high in 2025. The overall share of major European countries has been declining steadily, while the share of emerging markets such as Brazil and Russia has remained stable. The decline in sales volume in the Chinese market in the first 9 months of 2026 is the core reason for changes in global share. The rapid growth in emerging markets such as India has to some extent hedged the growth pressure of the Chinese and US markets and supported the global car market to maintain a slight positive growth.
From east to west, with the exception of Toyota, Hyundai, Kia, Suzuki, and Tata, the share of other international brands declined sharply in 2026. Compared to 2019, China's own brands have increased their global share across the board. Geely, BYD, Chery, SAIC, Changan, etc. have strong independent performance. In addition to favorable factors in the Indian market such as Suzuki, the shares of other European and American international brands have declined significantly across the board.
Auto industry profit margin 3.3% from January to September 2026
From January to September, large-scale industrial enterprises achieved operating income of 106.21 trillion yuan, an increase of 6.6% year on year; operating costs of 90.30 trillion yuan, an increase of 6.1%; and the profit margin on operating income was 5.68%, an increase of 0.44 percentage points over the previous year. From January to September 2026, profits in the electronics industry, driven by artificial intelligence, doubled, and profits in the upstream raw materials industry grew at a high rate, which contributed greatly to the improvement of the overall profit of the industry. The automobile industry faced the double pressure of rising costs and weak demand, and profit performance was poor. From January to September 2026, automobile production was 23.37 million vehicles, down 4% year on year, revenue of 80,43.5 billion yuan increased 2.6%, cost of 7162.7 billion yuan increased 3.8%, profit of 267.5 billion yuan decreased 23%, and sales margin was 3.3%; of these, automobile production in September was 3.06 million units, sales revenue of 1,037.4 billion yuan increased 0.6%, cost of 925.7 billion yuan increased 2.5%, profit of 14.2 billion yuan, and sales margin 1.4%, which is at a low level of nearly 4 years.
In 2026, various regions vigorously promoted the implementation of the “two new” policies to gradually and effectively release the vitality of domestic demand, but the improvement in efficiency in the automobile industry clearly lags behind other consumer goods. As the country's anti-domestic countervailing efforts continue to advance, the automobile industry is being severely squeezed upstream. The price problem is serious. Oil prices have skyrocketed, profits from non-ferrous metals and semiconductors have skyrocketed, end users have a serious wait-and-see mentality when buying cars, the operating pressure on car companies continues to increase, and high-quality development has been greatly impacted upstream.
In September 2026, China imported 21,000 vehicles
In September 2026, 21,000 imported cars were imported, down 49% year on year and 6% month on month. The decline was astonishing. From January to September 2026, 290,000 vehicles were imported, a year-on-year decrease of 20%. Passenger cars account for over 99% of the automobile import structure this year. If pickups in light trucks are included, the number of passenger cars is even higher. The 15% increase in imported hybrid vehicles from January to September 2026 showed good performance. Pure electric passenger cars fell 27%, plug-in hybrid fell 54%, and imported new energy passenger vehicles showed weak performance. The displacement of imported models of passenger cars is concentrated on gasoline models below 2 liters. Last year, 3-4 liters had a better ability to withstand falling, and 1.5-2 liters was relatively good this year.
The downward pressure on imported cars in September was still strong. The top 10 countries with the highest imports in September 2026 were: Japan with 7,399 vehicles, Germany with 7,255 vehicles, the United Kingdom with 2,488 vehicles, Slovakia 1,418, Mexico 818, the United States 791, Austria 355, Belgium 112, Korea 95, and Italy with 90 vehicles. Among them, the top five increased vehicles over the same period were: Mexico 307, Austria 107, Belgium 42, South Korea 41, and France 16. The top 10 countries with the highest import volume in January-September 2026 were: Japan with 136,652 vehicles, Germany 66,438, the US 28,350, Slovakia with 20,422 vehicles, the United Kingdom with 18,803 vehicles, Mexico 4,974, Austria 4,193, Thailand 2,270, Italy 786, and South Korea with 760 vehicles. Among them, the top five increased vehicles over the same period: Thailand 2,027 vehicles, Austria 1,948 vehicles, Mexico 1,576 vehicles, China 540, and South Africa 373 vehicles.
In January-September of this year, the retail sale of 280,000 imported cars was poor, with a 32% drop. The performance was poor when it fell to 29,000 units in September, down 39%, and the pressure is still high. Demand in the domestic and imported luxury car markets is generally weak. Among them, the luxury car market in Beijing, Shanghai, Hangzhou, Chengdu, Shenzhen and other regions is under high pressure. This year, petroleum producing regions in northern and central western China, such as Xinjiang and Shandong, are strong.