


IDEX (IEX) just put fresh numbers on the table, reporting third quarter 2026 results that came in ahead of expectations and raising its full year adjusted earnings outlook.
The stronger Q3 release comes after a year in which IDEX has been rewarded in the market, with a year-to-date share price return of 32.56% and a 1-year total shareholder return of 43.35%, indicating sustained momentum rather than a short-lived bounce.
Compare IDEX's momentum with a curated group of industrials showing similar earnings strength by scanning the 30 resilient stocks with low risk scores, which pairs resilient balance sheets with measured risk profiles.
After a 32.56% year to date climb and guidance now set higher, the question around IDEX is simple: Is most of the re rating already in the price, or is investors' patience still being underpaid?
Preferred P/E of 32.5x: Is it justified?
On valuation, IDEX carries a P/E of 32.5x at a last close of $237.36, which places the stock at a richer earnings multiple than many peers.
The P/E ratio compares the current share price to earnings per share and gives a quick read on how much investors are paying for each dollar of profit. For a mature industrial group like IDEX, with forecast earnings growth of 12.85% per year and recent 12.1% year on year profit expansion, that price tag suggests the market is willing to pay up for consistency and quality of results.
That premium is not small. The current 32.5x P/E sits above the Machinery industry average of 24.4x and also above the peer average of 30.5x. The estimated fair P/E of 23.9x implies the valuation is stretched compared to a level the market could move towards if sentiment cools.
Explore the SWS fair ratio for IDEX.
Result: Price-to-earnings of 32.5x (OVERVALUED)
Still, IDEX depends heavily on industrial and firefighting demand cycles. Any slowdown in capital spending or public safety budgets could quickly challenge that premium.
Find out about the key risks to this IDEX narrative.
Another view on IDEX: cash flows tell a different story
The earnings multiple portrays IDEX as expensive, yet the SWS DCF model indicates something different. At a last close of $237.36 and an estimated future cash flow value of $284.15, the stock appears 16.5% below that fair value. Which signal should carry more weight for you?
Look into how the SWS DCF model arrives at its fair value.
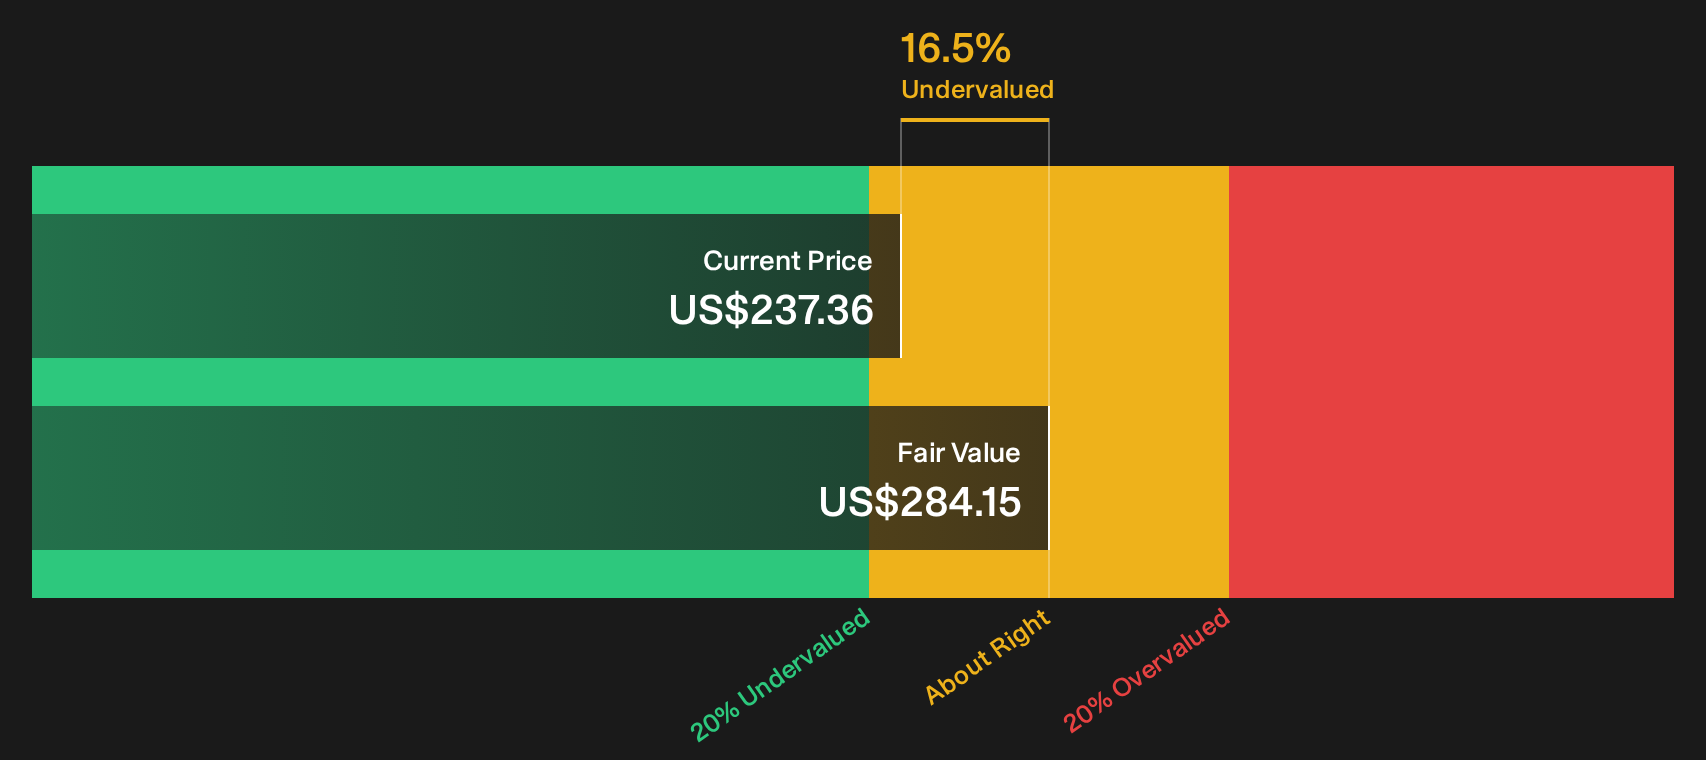
Simply Wall St performs a discounted cash flow (DCF) on every stock in the world every day (check out IDEX for example). We show the entire calculation in full. You can track the result in your watchlist or portfolio and be alerted when this changes, or use our stock screener to discover 35 high quality undervalued stocks. If you save a screener we even alert you when new companies match - so you never miss a potential opportunity.
Next Steps
If the mixed signals around IDEX leave you undecided, act while the data is fresh. Pressure test the upside story for yourself with the 3 key rewards.
Looking for more investment ideas beyond IDEX?
Do not stop with one strong story. Use the Simply Wall Street Screener to line up more candidates while IDEX's latest results are still front of mind.
- Target resilient balance sheets and lower volatility by scanning the 30 resilient stocks with low risk scores that filters for businesses with more measured risk profiles.
- Hunt for mispriced quality by reviewing the 35 high quality undervalued stocks that highlights companies combining stronger fundamentals with more modest valuations.
- Build a steadier income stream by checking the 4 dividend fortresses that focuses on higher yield payouts with robust underlying finances.
Have feedback on this article? Concerned about the content? Get in touch with us directly. Alternatively, email editorial-team@simplywallst.com