


When you consume as much financial media information as I do, you’re bound to develop biases. One of mine is that when I hear seemingly everyone on Wall Street picking the same market segments to buy, I immediately get skeptical.
This used to cost me dearly. Back when I was managing client money, my worst performance periods occurred when the crowd was on board with something and I intentionally left myself behind.
I’m feeling that way about energy these days. So I decided to investigate what’s really going on.
I’m no fundamental analyst, so I always admire the insights and experience of those who have mastered things like income statements, weather trends, and commodity supply and demand. My window to the world, instead, is that of a technician.
Combining my expertise with that of my fundamentals-driven peers, here’s my bottom-line view of the different parts of the energy sector, with the charts to tell the story.
Let’s start with natural gas stocks, in the form of First Trust Natural Gas ETF (FCG). The chart is here, and below it, I’ll present the top 10 holdings of its 40+ current set of stocks.
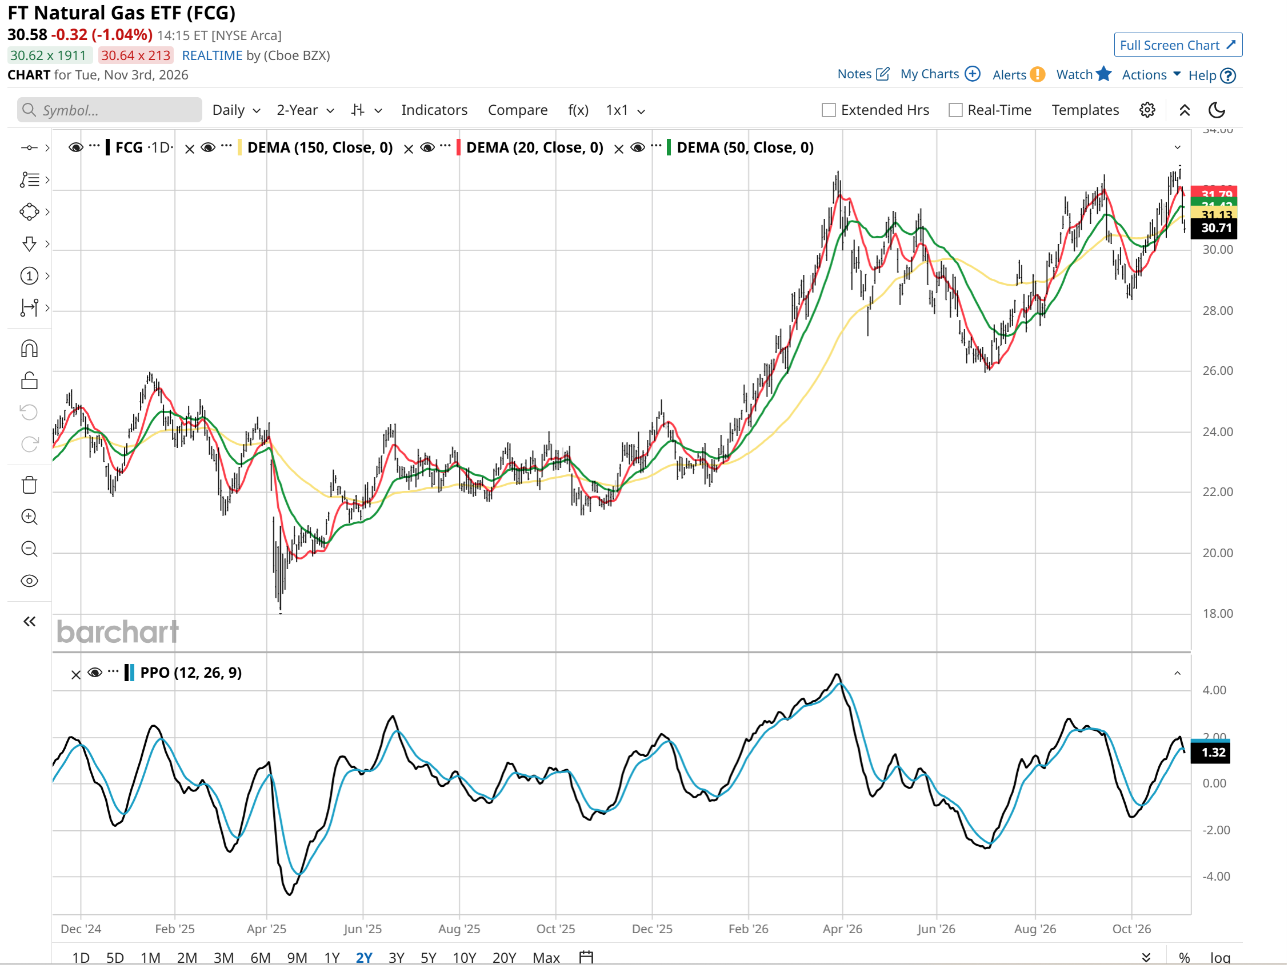
This chart just doesn’t get me excited to run out and buy natural gas (NGZ26) stocks, or any oil-focused names for that matter. It might have just created a triple-top. And the percentage price oscillator (PPO) indicator at bottom is just starting to roll over.
Now, here’s the ROAR Score analysis of FCG. Remember, this is a basket of stocks, so I’m reviewing the full basket, not the individual companies within it.
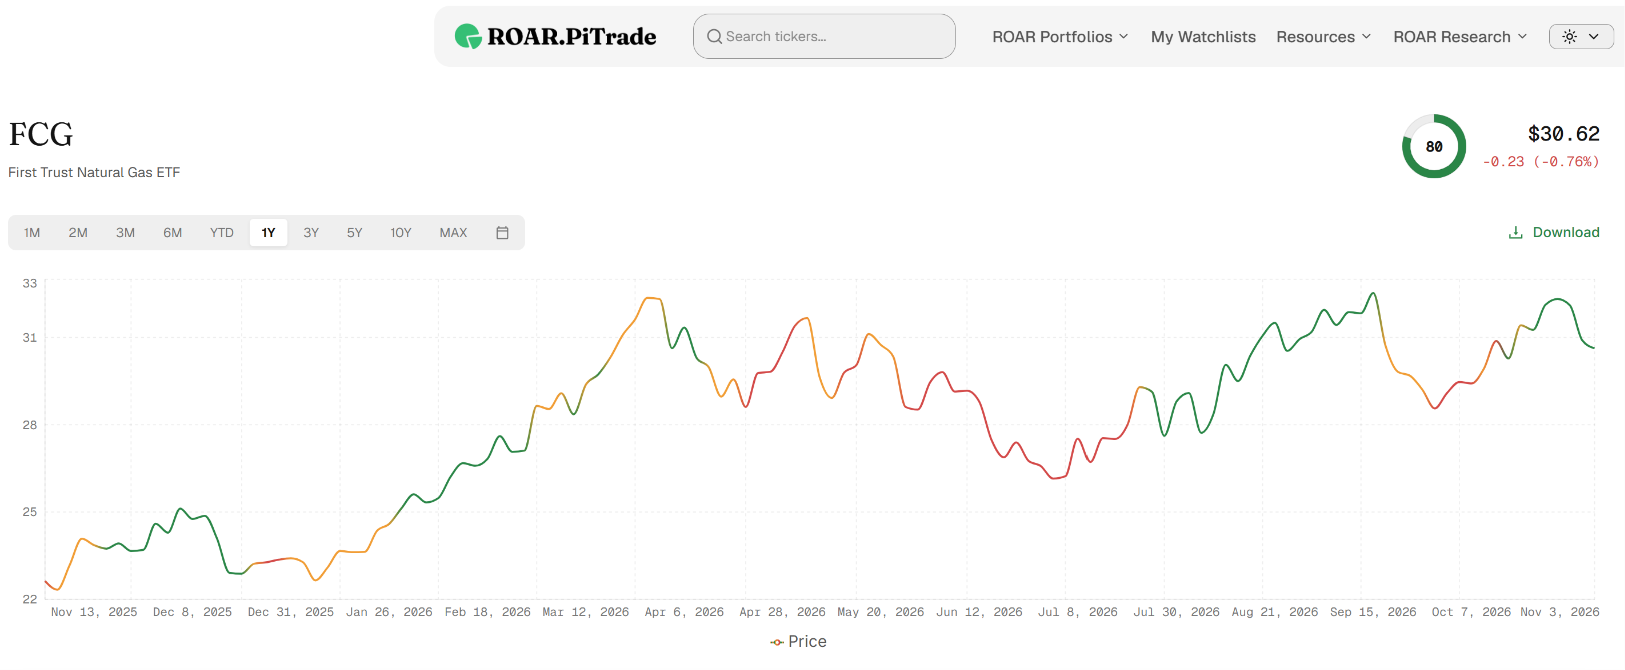
Interestingly, the ROAR Score is at 80. And while a higher number is generally better, 80 is essentially the market telling us “this has really spiked higher recently.” It is worth sticking around to see if FCG can climb still higher, as long as you pay close attention. The chart is more stretched than undervalued to me.
We need to look no further than this past September, when the color pattern above looked similar. That preceded a 9% pullback in just two weeks. Again, ROAR tells me that this ETF just had a big move, and that the “easy money,” if there is such a thing, has been made. That’s the bottom line.
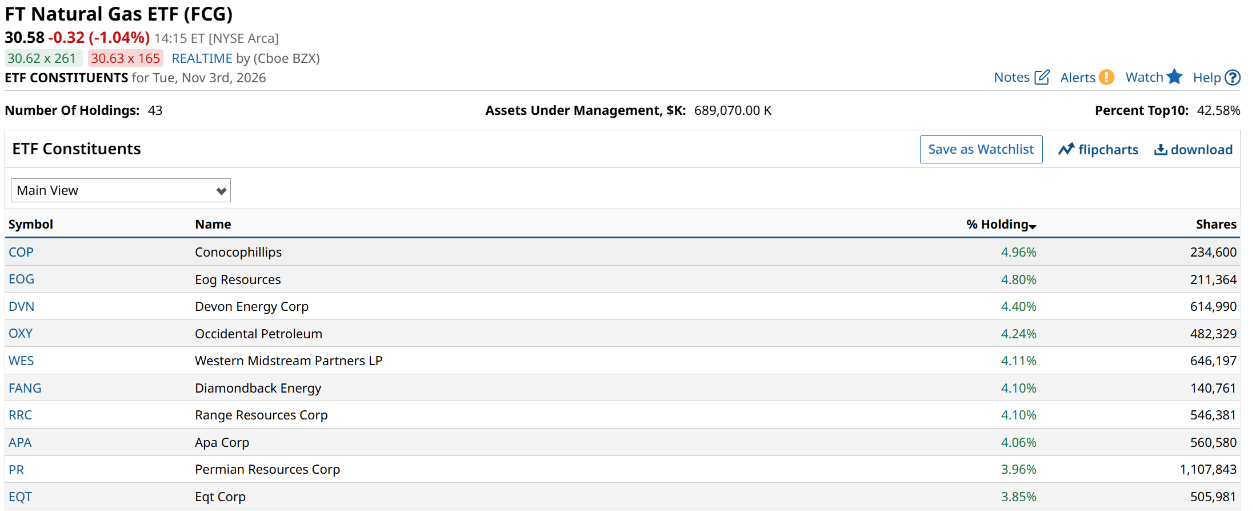
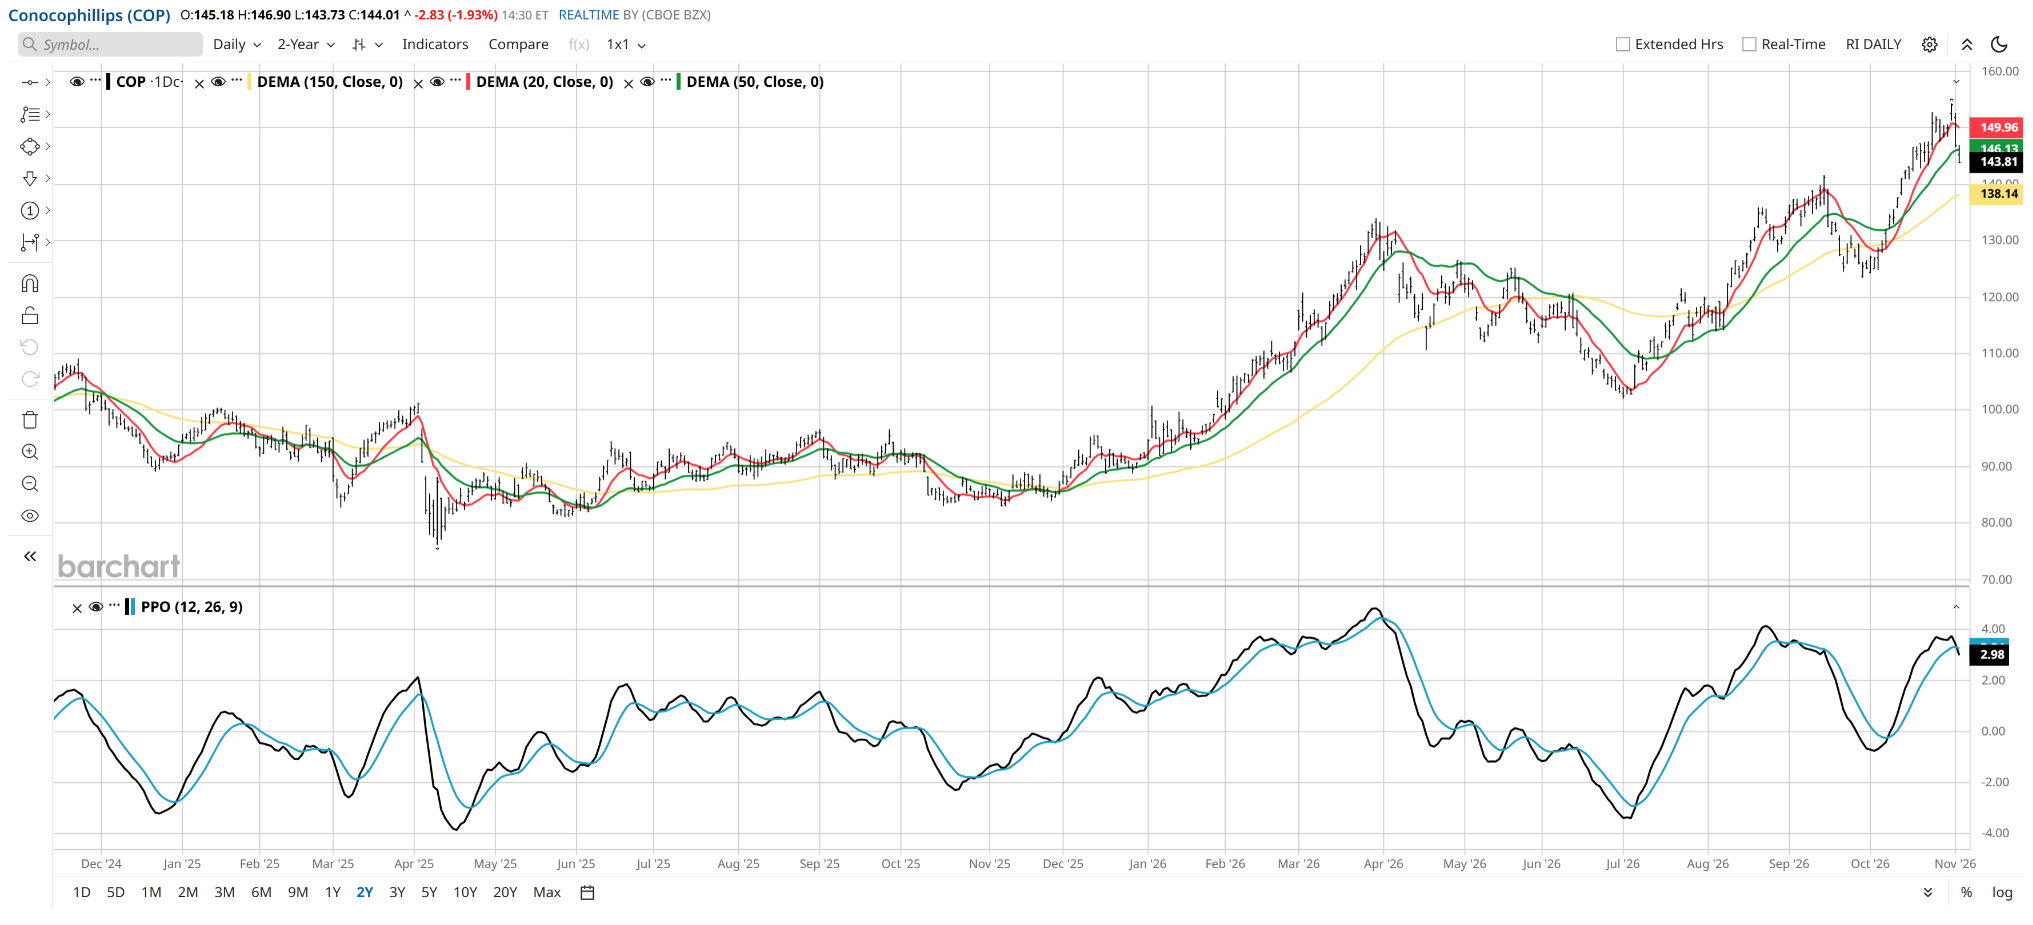
You see the top 10 holdings above, and this allows me to dive into some stocks and see if there are any that buck the energy trend. I charted them all. And they all look pretty similar to Conocophillips (COP) here. As in, not very strong.
Just in case, I checked out Alerian MLP ETF (AMLP) before closing the book on this topic. There are times when income-oriented names like AMLP can look much better than the traditional oil and gas crew because big yields are more attractive when interest rates fall.
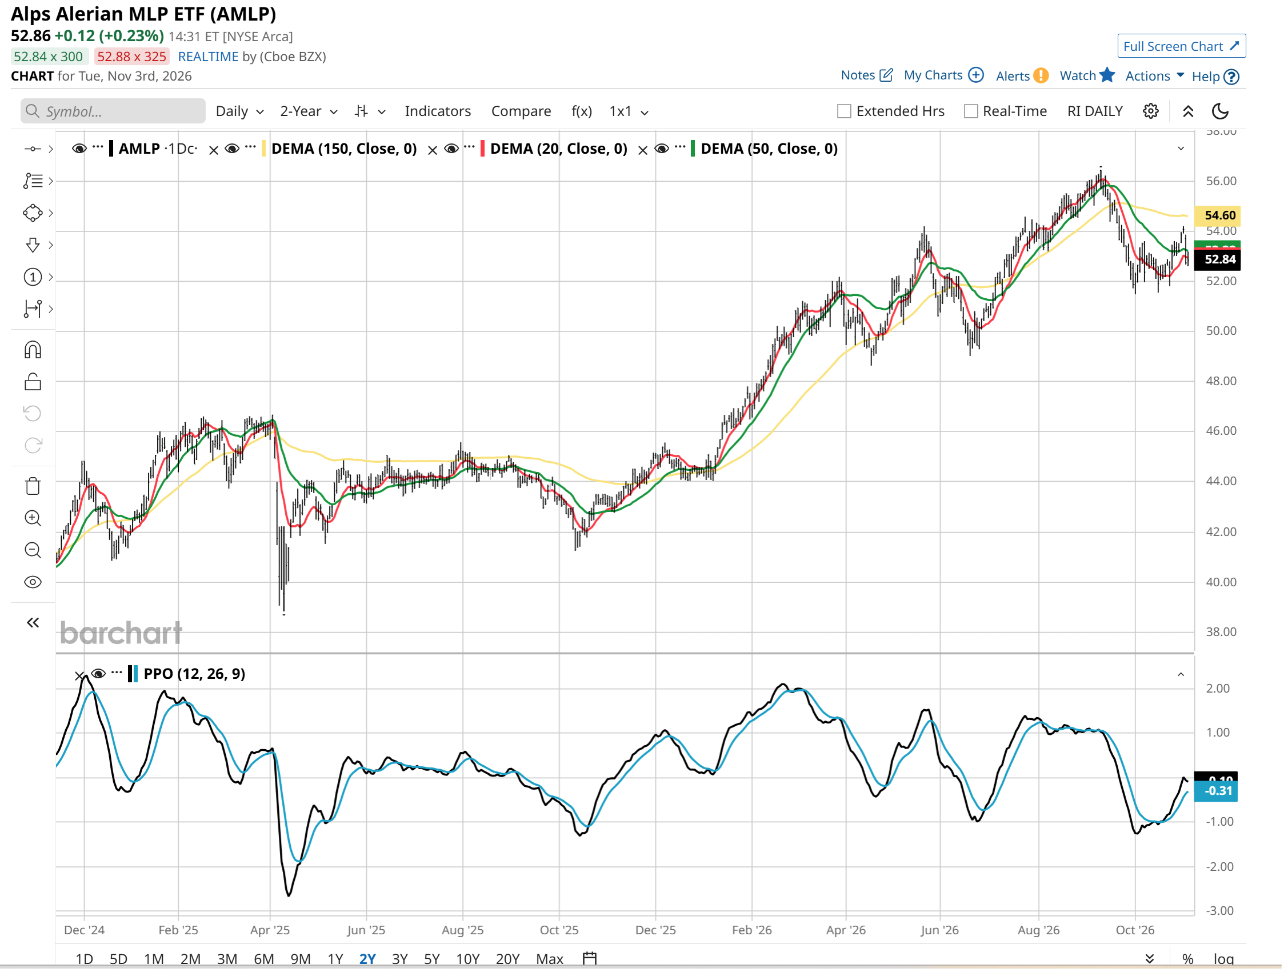
What I see in the chart above is a sub-segment of the energy trade that is perhaps a bit further along than FCG is to the downside. It rallied, corrected, but is now threatening to go lower.
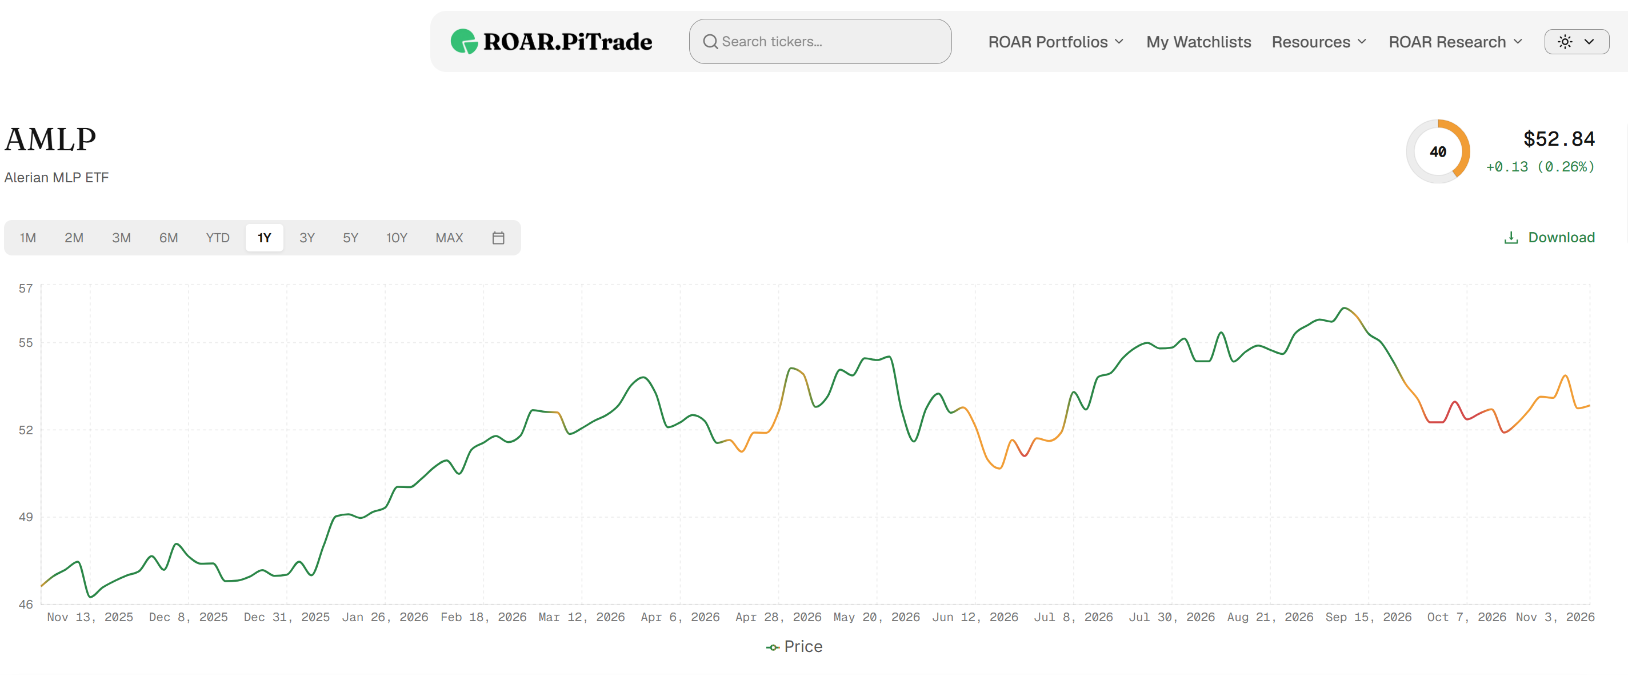
AMLP has a ROAR Score of 40, down from 60 two months ago. That might be a prelude to where FCG goes soon. If that happens, I’ll be looking more closely at an ETF like ProShares UltraShort Energy ETF (DUG), which is 2x short oil and gas stocks.
There’s always a way to try to make a profit. You just need to know what you are willing to risk and what your analysis directs you to do. Then, learning which ETFs to plug in for the task at hand becomes the easy part.
Rob Isbitts is a semi-retired CIO, former fiduciary investment advisor, Barchart columnist, and straight-talker. Download his new free e-book on hedged bond investing for retirement at ETFYourself.com. His research and model portfolios are at ROAR.PiTrade.com.
On the date of publication, Rob Isbitts did not directly have a position in any of the securities mentioned in this article. All information and data in this article is solely for informational purposes. For more information please view the Barchart Disclosure Policy here.