


Flex (FLEX) just posted fresh quarterly results and raised its outlook, with year over year gains in sales, profit, and earnings per share, along with higher revenue targets for the coming quarter and full fiscal year.
The share price reaction has been sharp, with Flex falling 12.33% over the last trading day and down 36.37% over 30 days. However, the year to date share price return is 21.29% and the 5 year total shareholder return is 480.89%, so recent weakness comes after a very strong longer run and indicates that sentiment has cooled despite the upgraded guidance.
Scan how Flex compares with other hand picked contract manufacturers and tech suppliers using the 19 high quality undiscovered gems before the next wave of earnings resets expectations.
Flex just lifted its revenue outlook while the share price slid hard. That gap between stronger fundamentals and softer sentiment now puts the valuation under the spotlight.
Most Popular Narrative: 41% Undervalued
Flex closed at $77.24 while the most followed narrative pegs fair value at $130.26. This frames the recent share price slide as a valuation gap rather than a reset in the long term story.
Flex is transitioning from a cyclical, low-margin manufacturer into a high-margin, sticky, engineered-solutions partner. It sits squarely at the intersection of three massive macro trends: the AI infrastructure explosion, global supply chain nearshoring, and energy transition power management. As the market continues to re-rate Flex from a legacy manufacturer to a critical tech enabler, its long-term fundamental trajectory points firmly upward.
See why 7 investors see Flex as 41% undervalued.
Result: Fair Value of $130.26 (UNDERVALUED)
Still, that story can break if Flex stumbles on the CPI spin off execution or if AI infrastructure demand slows, which would leave its higher earnings expectations exposed.
Find out about the key risks to this Flex narrative.
Another View: Flex Through The P/E Lens
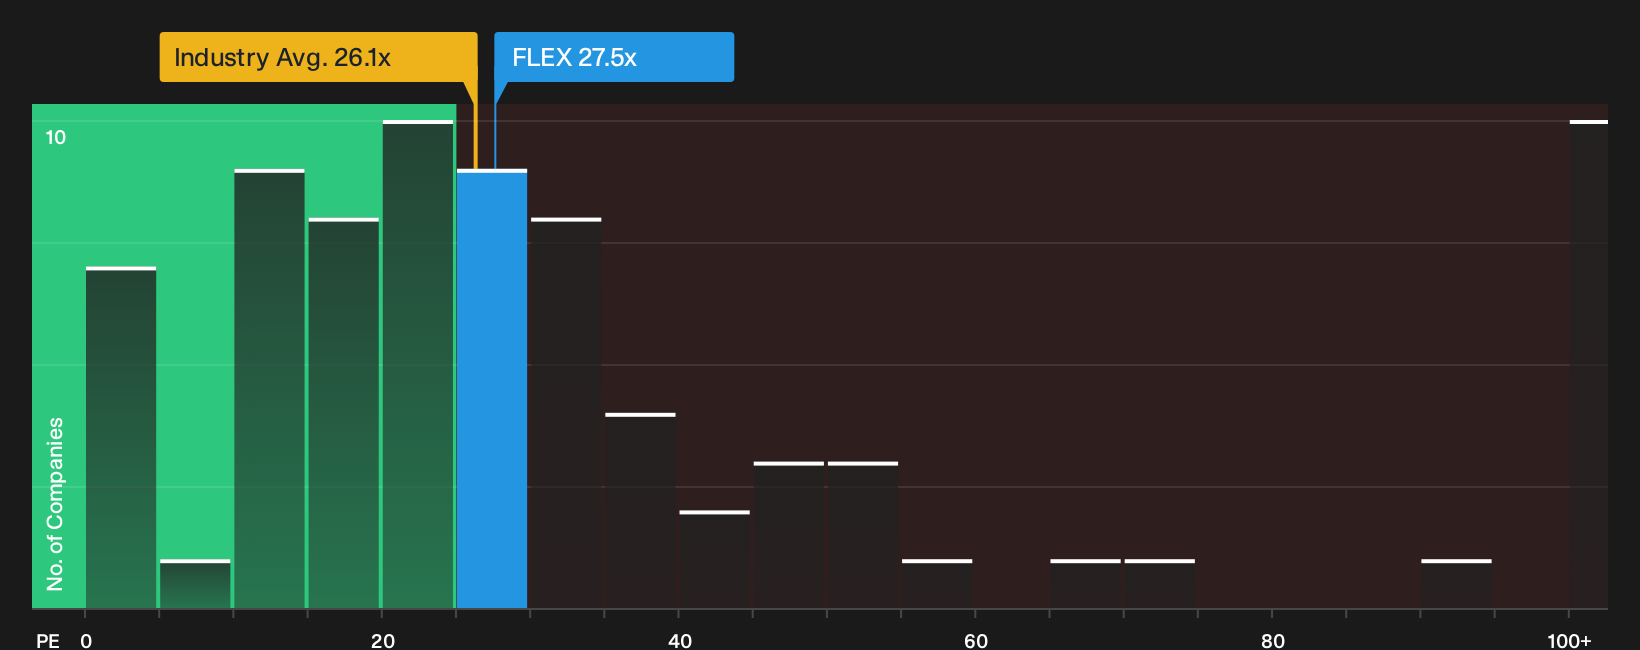
On the first cut, Flex looks cheap against a $130.26 fair value, yet the P/E story pushes back. The stock trades on 27.5x earnings, above the US Electronic industry on 26.1x and ahead of peer averages at 23.9x.
The fair ratio sits much higher at 59.4x. That gap flags a trade off. Either investors accept a richer multiple if the business hits expectations, or current holders face pressure if sentiment shifts toward the lower industry and peer markers. Which way do you think the crowd leans from here?
See what the numbers say about this price, See what the numbers say about this price — find out in our valuation breakdown.
Next Steps
Plenty of investors see Flex as mispriced right now, but no narrative is complete until you have checked the details yourself and weighed the optimism against the risks. To see what is driving that optimism in the data, take a closer look at the 4 key rewards.
Looking For More Investment Ideas Beyond Flex?
If you stop with Flex, you only see one corner of the opportunity set. Cast the net wider now so you are not reacting after the next move.
- Target resilient cash generators with strong balance sheets by scanning the list of solid balance sheet and fundamentals (24 results) that highlight financially robust businesses ready for tougher conditions.
- Hunt for quality at a discount by reviewing the 35 high quality undervalued stocks that flag companies where fundamentals and current pricing look out of sync.
- Strengthen your income stream by checking the 5 dividend fortresses that surface higher yielding payers with the potential for more stable payouts.
Have feedback on this article? Concerned about the content? Get in touch with us directly. Alternatively, email editorial-team@simplywallst.com