


Liquidity Services (LQDT) has drawn fresh attention after recent share price moves, with the stock closing at US$46.76. That level gives the asset management and auction platform a market value of about US$1.47b.
Recent trading has come on top of a much longer upswing, with Liquidity Services showing a 12.65% 1 month share price return and a 58.03% year to date share price return. The 1 year total shareholder return of 111.01% points to strong momentum rather than a short lived spike.
Scan other asset heavy platforms showing similar momentum by running the 19 high quality undiscovered gems alongside Liquidity Services in your watchlist.
Bulls see Liquidity Services as a cash generative marketplace now priced for its improved execution, while bears argue the recent run-up already reflects that progress. Which side do the current valuation markers support?
Price-to-Earnings of 44.1x: Is It Justified?
On current numbers, Liquidity Services trades on a P/E of 44.1x, which is rich territory when set against both its own fair ratio estimate and sector peers.
The P/E ratio compares what investors pay today for each dollar of earnings. For a marketplace and service business like Liquidity Services, a higher multiple usually implies investors are factoring in stronger profit expansion or a more resilient earnings profile.
Here, the gap is wide. Liquidity Services carries a 44.1x P/E, while the US Commercial Services industry average sits at 18.9x. The estimated fair P/E for the stock is 23.4x. The current valuation level is almost double the sector and also sits well above where the regression based fair ratio suggests the market could eventually settle.
Explore the SWS fair ratio for Liquidity Services.
Result: Price-to-Earnings of 44.1x (OVERVALUED)
Still, Liquidity Services relies on government and commercial partners continuing to offload surplus at current levels, and any slowdown in auction volumes could quickly challenge today’s premium P/E.
Find out about the key risks to this Liquidity Services narrative.
Another View on Liquidity Services: DCF vs Market Multiple
The rich 44.1x P/E suggests Liquidity Services trades on a steep earnings multiple, yet the SWS DCF model paints a different picture. On those cash flow assumptions, an estimated fair value of about $54.83 per share puts the current $46.76 price roughly 14.7% below that mark.
That flip from expensive on earnings to cheaper on cash flow raises a practical question for you: Is the crowd overpaying for near term profitability, or is the DCF leaning too heavily on future growth that might not materialise?
Look into how the SWS DCF model arrives at its fair value.
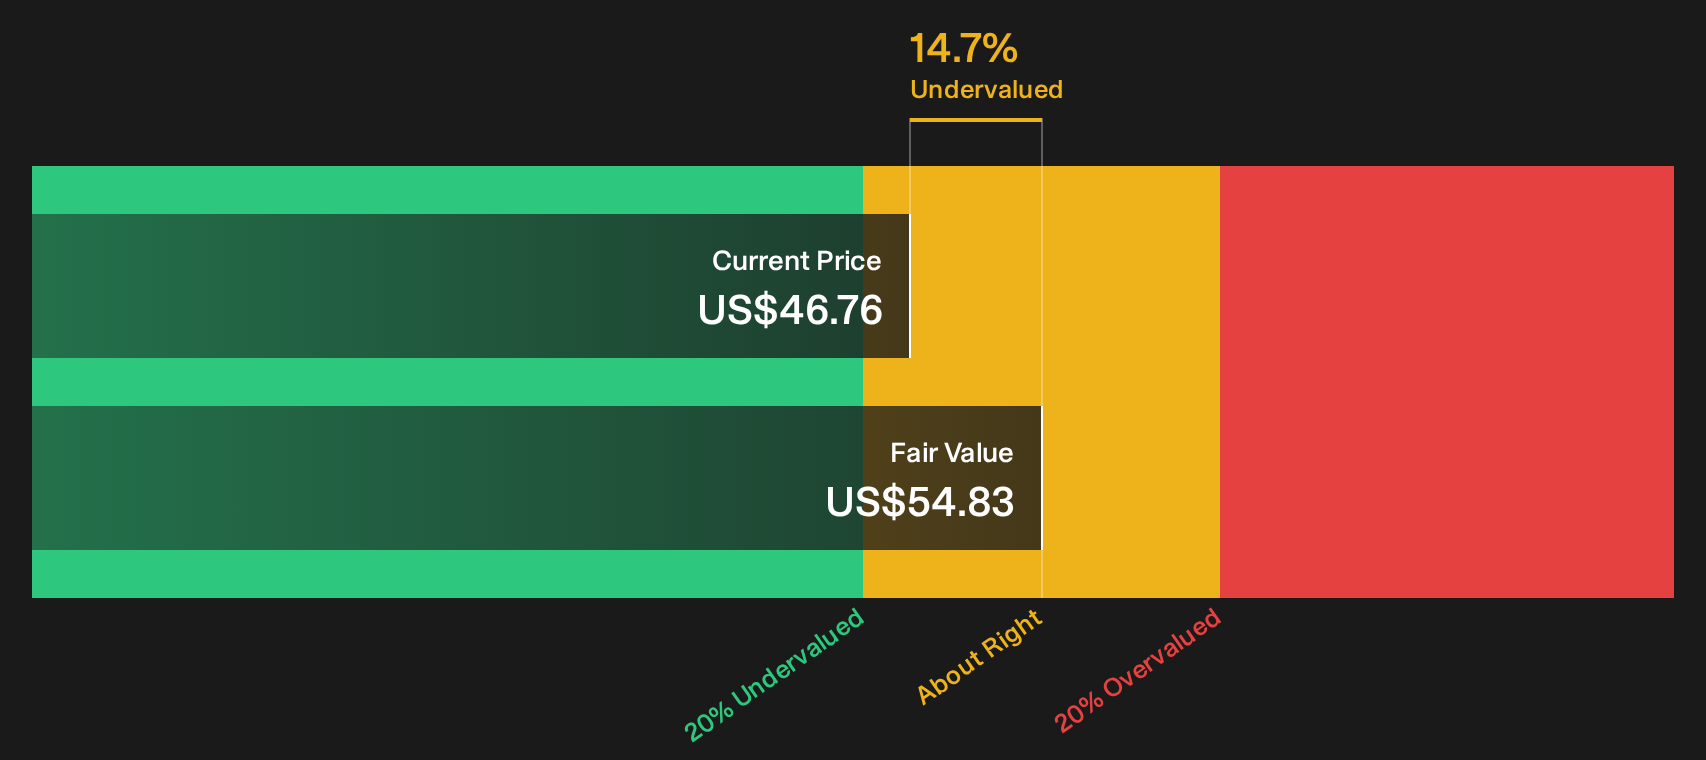
Simply Wall St performs a discounted cash flow (DCF) on every stock in the world every day (check out Liquidity Services for example). We show the entire calculation in full. You can track the result in your watchlist or portfolio and be alerted when this changes, or use our stock screener to discover 35 high quality undervalued stocks. If you save a screener we even alert you when new companies match - so you never miss a potential opportunity.
Next Steps
That is a punchy mix of optimism and caution, and the clock never stops on re-rating stories like Liquidity Services, so pressure test the momentum narrative yourself by weighing the 3 key rewards against your own read of the numbers.
Looking for more investment ideas beyond Liquidity Services?
If Liquidity Services has sharpened your focus on quality, do not stop there. Broader idea hunting with a disciplined stock screener can help round out your watchlist.
- Target dependable compounders by scanning a 35 high quality undervalued stocks that combines quality fundamentals with prices that still look reasonable on multiple checks.
- Prioritise staying power by reviewing a list of solid balance sheet and fundamentals (24 results) that highlights companies with sturdy finances supporting their future plans.
- Spot early stage opportunities by checking a 7 elite penny stocks with strong financials that already show stronger financial traits than the usual speculative fare.
Have feedback on this article? Concerned about the content? Get in touch with us directly. Alternatively, email editorial-team@simplywallst.com