


Formula One Group stock triggered by recent trading move
Formula One Group (FWON.K) has caught investor attention after a single day gain of about 3.5%, building on roughly 6.8% progress over the past week.
This recent bump lands on top of a month return near 3.5%, even as the past 3 months show a decline of about 3.8%, keeping short term sentiment mixed.
At a share price of $98.93, Formula One Group has seen short term share price momentum pick up, while the 1 year total shareholder return remains slightly negative and the 3 and 5 year total shareholder returns remain firmly positive.
Scan how Formula One Group's recent swing compares with other stocks showing strong price action and fundamentals using our curated 19 high quality undiscovered gems list.
Formula One Group looks like a robust media and motorsports franchise, and the latest price jump highlights that appeal. The real tension now sits in the valuation. Are you paying a fair price for that strength today?
Price-to-Earnings of 97.3x for Formula One Group: Is it justified?
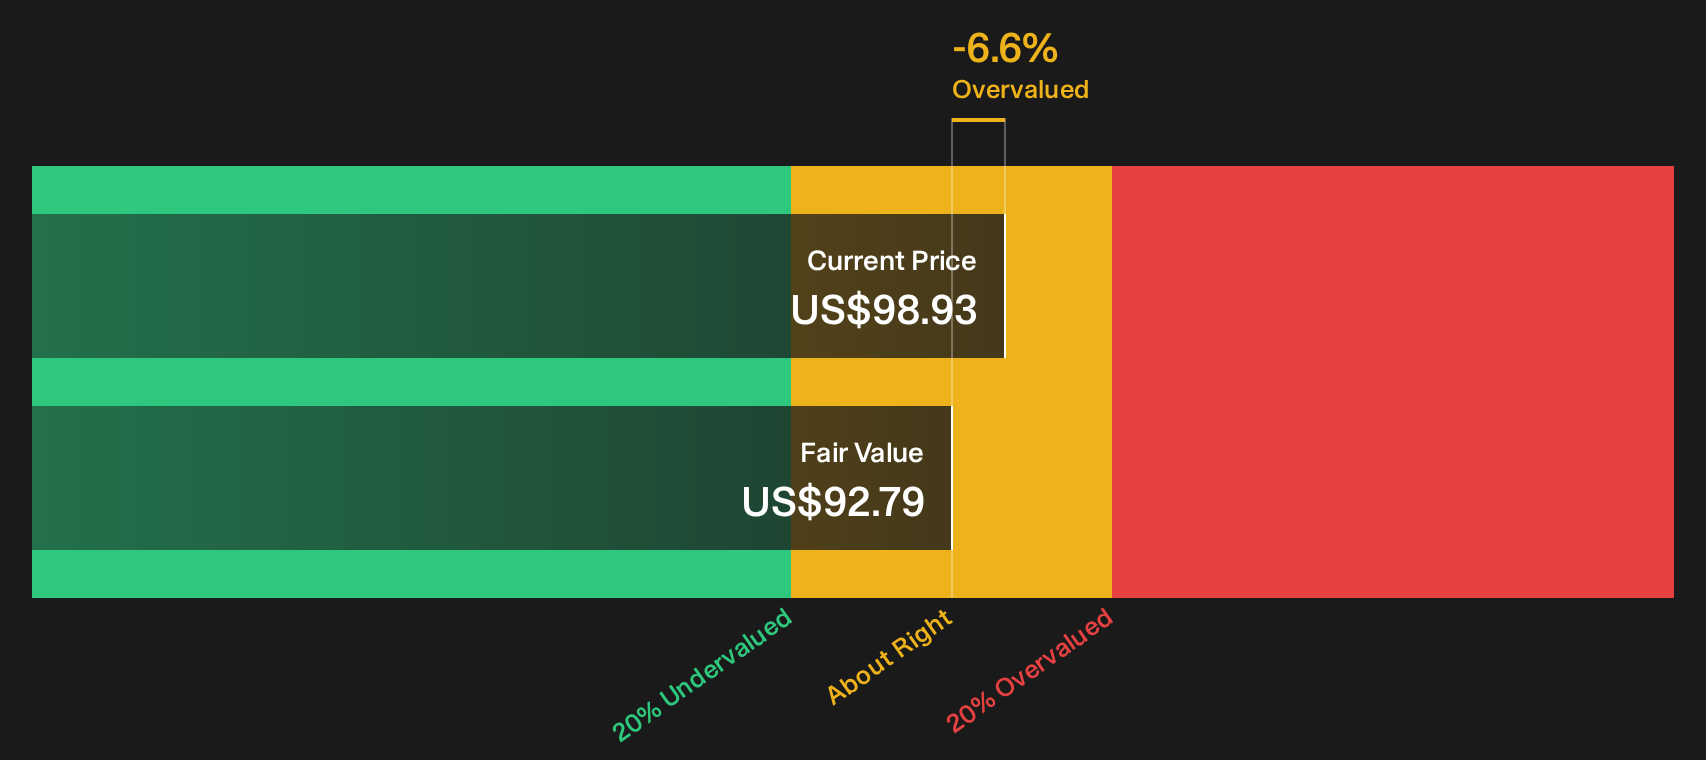
Formula One Group shares closed at $98.93 while the SWS DCF model points to a future cash flow value of $92.79, and the current valuation also reflects a very rich P/E of 97.3x against much lower benchmarks.
The P/E ratio links what investors pay today to the earnings the business generates. For a media and motorsports rights holder like Formula One Group, that benchmark indicates how much of a premium the market is placing on its brand, contracts and broadcast income relative to current profits.
Here the premium is steep. A P/E of 97.3x is far above the US Entertainment industry average of 17.6x and also well ahead of the peer group average of 36.5x. It is even materially higher than the estimated fair P/E of 27.2x that the fair ratio model suggests the market could move towards if pricing lined up more closely with historical relationships between valuation and fundamentals.
Explore the SWS fair ratio for Formula One Group.
Result: Price-to-Earnings of 97.3x (OVERVALUED)
Still, the Formula One Group story can crack if fan engagement cools or if key race contracts and media deals become harder to renew on current terms.
Find out about the key risks to this Formula One Group narrative.
Another view on Formula One Group's value
The SWS DCF model paints a different picture for Formula One Group. At a share price of $98.93 and a future cash flow value estimate of $92.79, the stock screens as slightly overvalued on this framework. That gap is not huge, but it does leave less room for error if expectations slip.
Our DCF model also relies on assumptions about future cash generation, so readers should treat it as one lens rather than a verdict. The real question is whether you trust these cash flow forecasts more than the earnings multiple the market is currently willing to pay, or whether both are now baking in too much optimism.
Look into how the SWS DCF model arrives at its fair value.
Simply Wall St performs a discounted cash flow (DCF) on every stock in the world every day (check out Formula One Group for example). We show the entire calculation in full. You can track the result in your watchlist or portfolio and be alerted when this changes, or use our stock screener to discover 35 high quality undervalued stocks. If you save a screener we even alert you when new companies match - so you never miss a potential opportunity.
Next Steps
Mixed messages in the numbers, or a clear story taking shape? Act while the facts are fresh and stress test the bullish and cautious angles by weighing the 2 key rewards and 2 important warning signs.
Looking for more Formula One Group style investment ideas?
If Formula One Group has you thinking harder about price, quality and risk, now is the time to widen your watchlist before the next move catches you off guard.
- Target potential mispricing by scanning a curated pool of quality companies that look cheap on fundamentals using the 35 high quality undervalued stocks.
- Prioritise resilience and cut down on nasty surprises by checking a 31 resilient stocks with low risk scores built around sturdier balance sheets and steadier metrics.
- Spot financially sound opportunities that are not yet crowded by institutions through the carefully filtered 19 high quality undiscovered gems.
Have feedback on this article? Concerned about the content? Get in touch with us directly. Alternatively, email editorial-team@simplywallst.com