


SLB (NYSE:SLB) just combined a mixed third quarter earnings report with fresh contract wins and a new Canadian facility tied to Meta, giving investors several moving pieces to weigh at once.
These mixed headlines land against a backdrop where SLB’s share price has risen 28.26% year to date to around $51.56, while its 1 year total shareholder return of 44.52% points to strong momentum that has cooled slightly in recent weeks as the stock slipped 4.07% over the last 7 days.
Scan how SLB compares to other potential beneficiaries of energy and infrastructure themes by reviewing a curated 41 power grid technology and infrastructure stocks that may also be catching fresh contract momentum.
Bulls see SLB’s pullback as a chance to buy a diversified energy technology leader, while bears focus on flat earnings and ETF selling. Which story do the current cash flows and multiples ultimately support?
Most Popular Narrative: 17% Undervalued
SLB’s most followed valuation narrative places fair value at about $62.41, compared with the recent close near $51.56. This frames the current pullback as a gap between the share price and what long term cash flows might justify under that view.
Rapid scaling of SLB’s Data Center Solutions business, backed by a backlog that underpins an annualized revenue run rate exceeding US$2 billion by the end of 2027 and medium term targets of US$4.5 billion to US$5.0 billion of data center revenue and US$700 million to US$800 million of adjusted EBITDA in 2028 after the Kelvion acquisition, introduces a large, capital light revenue stream that can add meaningfully to consolidated revenue, EBITDA and cash generation.
See why 170 investors see SLB as 17% undervalued.
Result: Fair Value of $62.41 (UNDERVALUED)
Still, that 17% valuation gap depends on smooth execution. Prolonged Middle East disruption or weaker than expected data center scaling could quickly challenge the bullish SLB narrative.
Find out about the key risks to this SLB narrative.
Another View: What SLB’s P/E Is Telling You
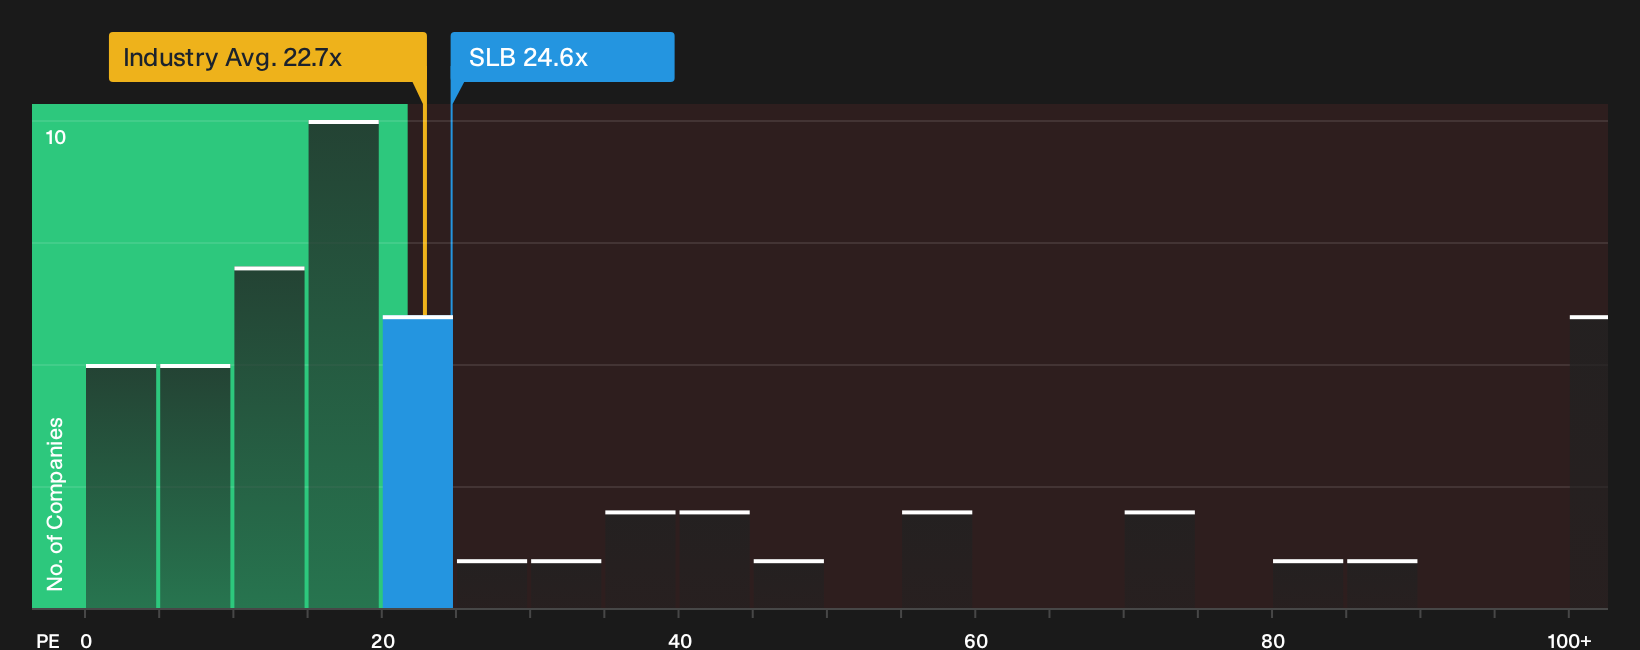
The discounted cash flow work points to SLB trading below an estimated future cash flow value of $84.62, yet the current P/E of 24.6x sits above the US Energy Services industry on 22.7x, the peer average of 23.8x and even an estimated fair ratio of 23.2x. Does that premium signal quality the market is willing to pay for, or a tighter margin for error if the growth story wobbles?
For a closer look at how this earnings multiple compares to cash flow based value, and what that might mean for risk, See what the numbers say about this price — find out in our valuation breakdown.
Next Steps
Mixed signals or a clear setup? Act quickly by reviewing the numbers yourself, weighing both the concerns and the upside, then benchmarking those impressions against the 3 key rewards and 2 important warning signs.
Looking for more investment ideas beyond SLB?
If SLB has sharpened your focus, do not stop here. Broaden your watchlist with fresh ideas that match your goals, risk limits and income needs.
- Target resilient balance sheets and steady fundamentals by scanning a curated list of solid balance sheet and fundamentals (24 results) that keeps financial strength front and centre.
- Hunt for potential value opportunities by reviewing a focused 35 high quality undervalued stocks that filters for quality businesses priced below their assessed worth.
- Strengthen your income stream by assessing a curated 5 dividend fortresses that highlights higher yielding companies with supportive fundamentals.
Have feedback on this article? Concerned about the content? Get in touch with us directly. Alternatively, email editorial-team@simplywallst.com