


Frasers Group (LSE:FRAS) is back in focus after Sports Direct opened two Nairobi stores through a partnership with Hudson Group, and the retailer secured majority control of Hugo Boss at 50.08%.
Frasers Group shares have been strong, with a 1-month share price return of 16.83% and a year-to-date share price gain of 42.99%. The 1-year total shareholder return of 38.84% suggests recent expansion moves are feeding into both price momentum and investor expectations.
Scan how Frasers Group compares with other retailers pushing for scale and global reach by reviewing our curated list of 5 high quality undiscovered gems.
Frasers Group has already rewarded shareholders with strong recent gains. However, the Hugo Boss stake and global push have only just shifted gear. Are you looking at early innings or a story that has largely been priced in?
Preferred P/E of 12x for Frasers Group: Is it justified?
Frasers Group trades on a P/E of 12x, which sits below several benchmarks even after the recent share price surge to £9.58.
The P/E ratio compares the current share price with earnings per share. For a retailer with multiple brands, gyms, and financing operations under one roof, it acts as a quick shorthand for how much investors are willing to pay for each £1 of profits.
Frasers Group’s multiple is below the UK market at 16.4x, below the UK Specialty Retail industry at 14.6x, and below the peer average at 15.2x. The estimated fair P/E of 17.3x is also well above the current 12x level. This indicates a sizeable valuation gap that the market could move toward if earnings forecasts and business execution stay on track.
Explore the SWS fair ratio for Frasers Group.
Result: Price-to-earnings of 12x (UNDERVALUED)
Still, the Hugo Boss exposure and rapid push into regions such as Africa and Europe leave Frasers Group more sensitive to brand missteps and to weaker consumer spending.
Find out about the key risks to this Frasers Group narrative.
DCF says Frasers Group is fully priced
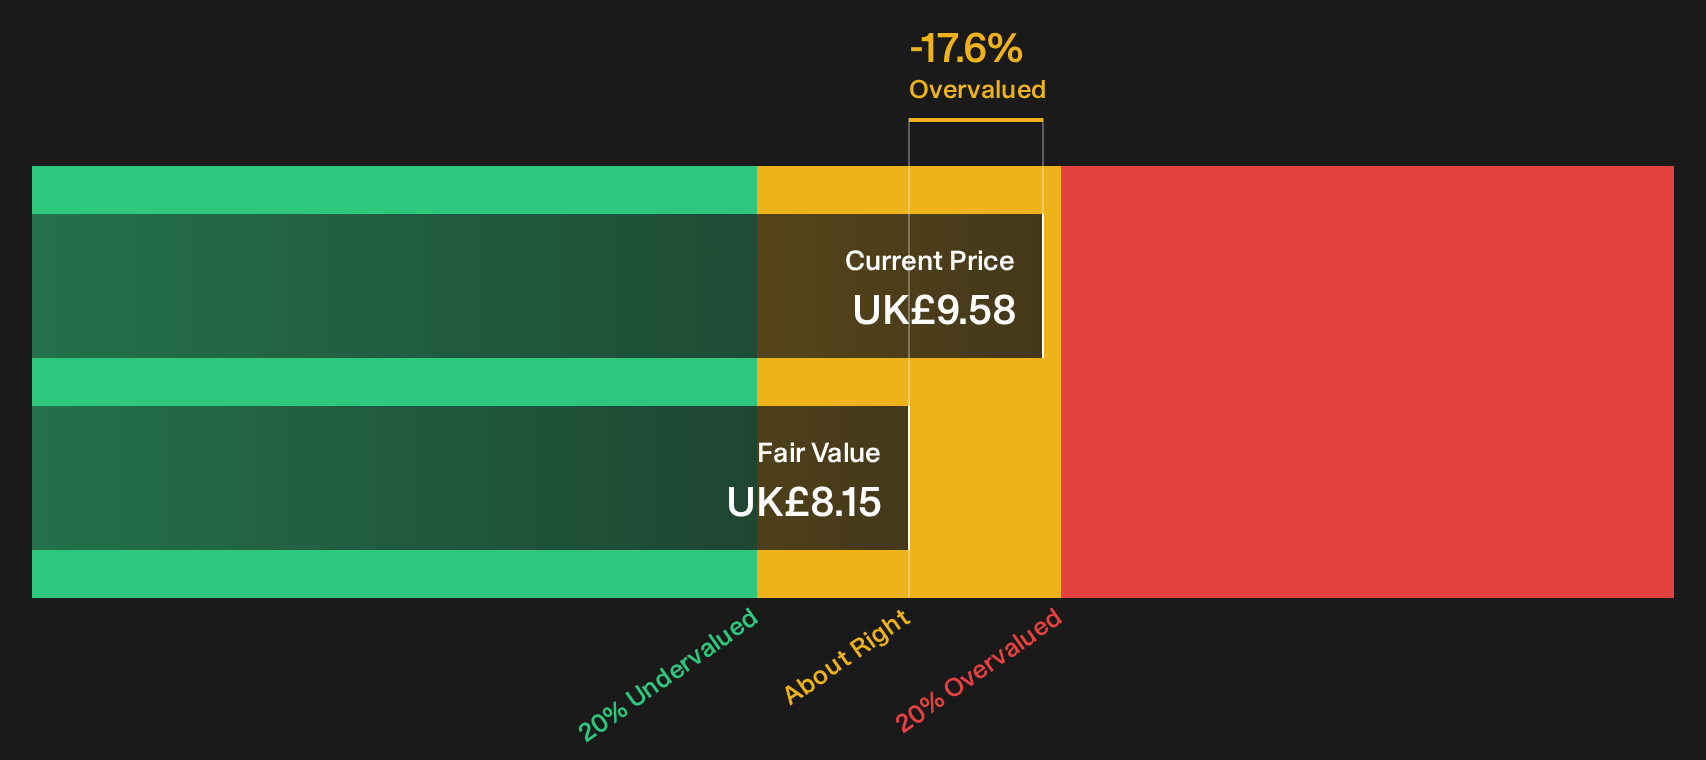
The earnings multiple paints Frasers Group as cheap, yet the SWS DCF model tells a different story. On that approach, the shares at £9.58 sit above an estimated future cash flow value of £8.15, which points to an overvalued outcome rather than a discount.
That gap implies less room for error if cash generation disappoints. It raises a simple question for you as an investor: do you put more weight on today’s earnings or on the longer term cash flow profile behind them?
Look into how the SWS DCF model arrives at its fair value.
Simply Wall St performs a discounted cash flow (DCF) on every stock in the world every day (check out Frasers Group for example). We show the entire calculation in full. You can track the result in your watchlist or portfolio and be alerted when this changes, or use our stock screener to discover 15 high quality undervalued stocks. If you save a screener we even alert you when new companies match - so you never miss a potential opportunity.
Next Steps
Sentiment around Frasers Group is split between excitement and caution, and the clock does not pause while you think it through. Take a moment to weigh both sides by reviewing the 4 key rewards and 2 important warning signs.
Want more ideas beyond Frasers Group?
If Frasers Group has your attention, do not stop there. Broader research often reveals alternatives that fit your goals even better.
- Target dependable growth by scanning a 15 high quality undervalued stocks that combine quality fundamentals with prices that still look restrained.
- Prioritise sleep-at-night resilience and review a 4 resilient stocks with low risk scores that score well on financial strength and business stability.
- Hunt for tomorrow's potential standouts before the crowd catches on by checking a 19 elite penny stocks with strong financials with stronger financials than most in their bracket.
Have feedback on this article? Concerned about the content? Get in touch with us directly. Alternatively, email editorial-team@simplywallst.com