


Fanuc (TSE:6954) just rolled out a bundled capital return update, announcing a ¥50,000 million buyback of 10,000,000 shares, a higher quarterly dividend, and fresh full year earnings guidance through March 2027.
Recent trading tells a mixed story. Fanuc’s share price has fallen about 9% over the past month and roughly 13% over the past quarter, yet the 1 year total shareholder return of 12.54% and 3 year total shareholder return of 56.54% point to longer term momentum that these new buyback and dividend moves may now be trying to support.
Scan how Fanuc compares with other capital return and automation plays by reviewing the hand picked 90 robotics and automation stocks that could benefit from similar buyback and dividend catalysts.
Fanuc appears to be a solid automation powerhouse, supported by fresh guidance and an expanded capital return package. The key question for investors is straightforward: are they paying a fair price for that strength today?
Preferred P/E of 26.2x: Is it justified for Fanuc?
On simple earnings math, Fanuc looks expensive. The shares last closed at ¥5,653 and the stock trades on a P/E of 26.2x, which is materially richer than both its own estimated fair P/E and the broader machinery peers.
P/E compares the current share price to annual earnings per share and effectively tells you how many years of profit the market is willing to pay for today. For a large automation supplier like Fanuc, this ratio often reflects how investors view the durability of its profit stream and the reliability of its order cycle.
Here, the market is paying a premium price. The P/E of 26.2x is more than double the JP Machinery industry average of 12.3x, and it also sits above the peer average of 19.7x. The estimated fair P/E of 21.1x is much lower than where Fanuc trades now, which points to a valuation level the market could shift toward if enthusiasm cools.
Explore the SWS fair ratio for Fanuc.
Result: Price-to-Earnings of 26.2x (OVERVALUED)
Still, the premium around Fanuc can unwind quickly if earnings guidance disappoints or if automation demand softens and investors question paying more than 26 times earnings.
Find out about the key risks to this Fanuc narrative.
Another View on Fanuc: What the DCF Says
The first check on Fanuc focused on its P/E premium. A different lens tells a similar story. Our DCF model estimates future cash flows at ¥4,564.85 per share, which sits below the recent ¥5,653 price and points to Fanuc trading on the expensive side. The real question is which signal you trust more when sentiment shifts.
Look into how the SWS DCF model arrives at its fair value.
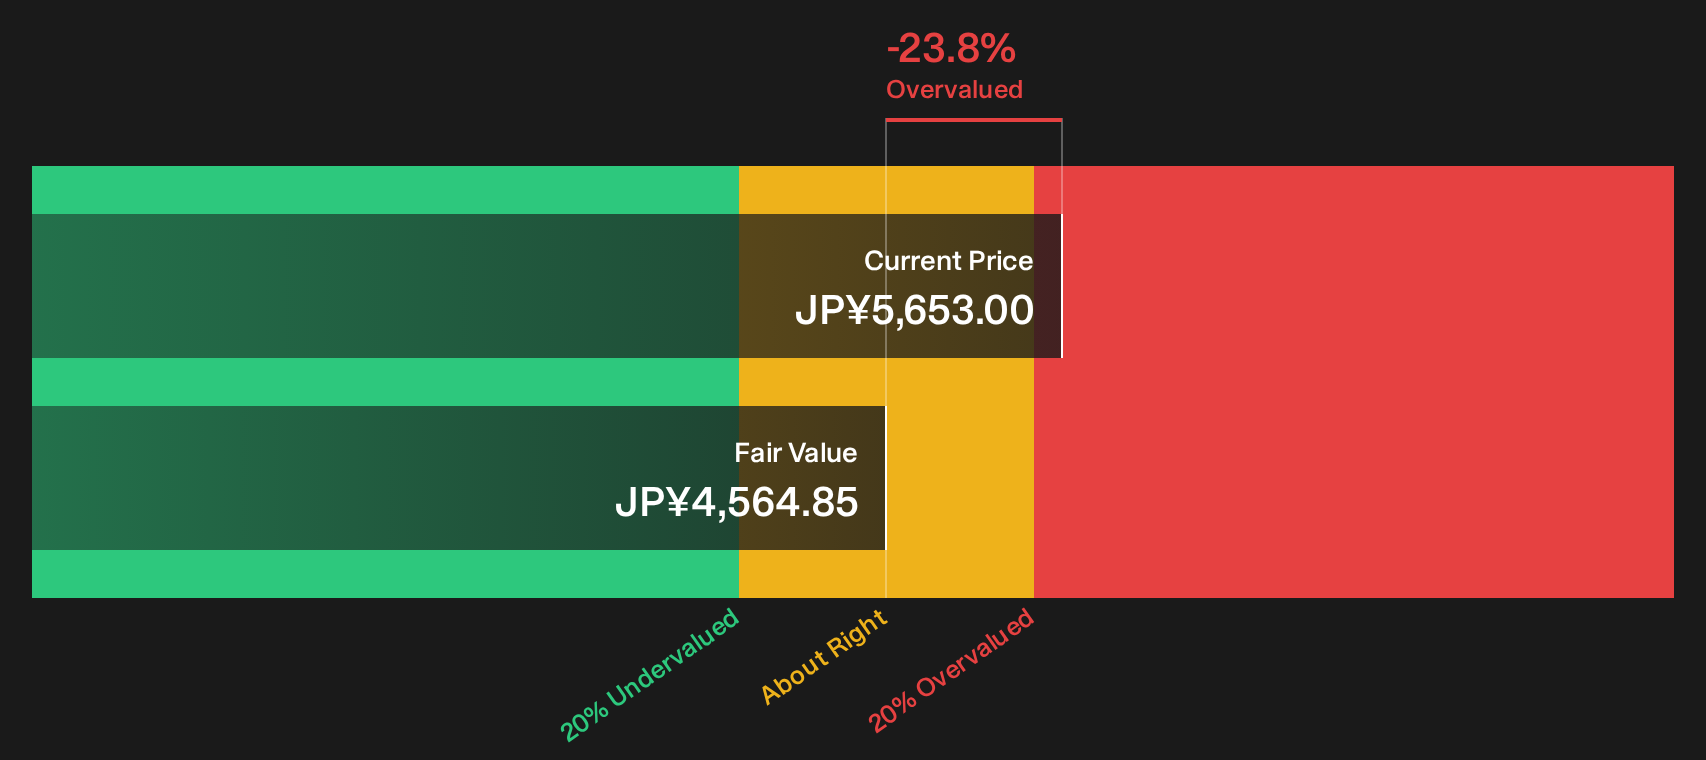
Simply Wall St performs a discounted cash flow (DCF) on every stock in the world every day (check out Fanuc for example). We show the entire calculation in full. You can track the result in your watchlist or portfolio and be alerted when this changes, or use our stock screener to discover 19 high quality undervalued stocks. If you save a screener we even alert you when new companies match - so you never miss a potential opportunity.
Next Steps
Unsure whether Fanuc’s premium valuation and guidance justify the risk reward mix described here? Act while the data is fresh and pressure test the balance of upside and downside using the 3 key rewards and 1 important warning sign
Looking for more investment ideas beyond Fanuc?
If Fanuc feels fully priced, cast the net wider and line up a few fresh ideas before the next round of capital return headlines hits.
- Target reliable cash generators by screening for companies with strong balance sheets and solid fundamentals using the list of solid balance sheet and fundamentals (23 results).
- Hunt for mispriced opportunities where quality and valuation meet by scanning our 19 high quality undervalued stocks.
- Spot underfollowed potential by reviewing the 74 high quality undiscovered gems that combine sound financials with room for a broader market to catch up.
Have feedback on this article? Concerned about the content? Get in touch with us directly. Alternatively, email editorial-team@simplywallst.com