


AllianceBernstein Holding (AB) has given investors two fresh data points to think about. The group reported flat third quarter earnings and paired that with a declared cash distribution of $0.88 per unit.
The fresh earnings and distribution news lands after a softer run for AllianceBernstein Holding’s units, with the share price down 5.98% over 90 days and 9.68% year to date. At the same time, the 3 year total shareholder return of 68.06% shows a much stronger longer term picture and hints that recent momentum has faded compared with earlier gains.
Spot 6 dividend fortresses, built for investors who want AllianceBernstein Holding’s income story to sit alongside other high-yield plays with an emphasis on stability.AllianceBernstein Holding now pairs a softer unit price with a fresh distribution and steady recent earnings. Do you lean into the current yield, or wait for a cheaper entry before that income stream feels compelling?
Most Popular Narrative: 5% Undervalued
AllianceBernstein Holding’s most followed valuation narrative pegs fair value at $36.71, a touch above the recent $34.90 close. This frames the latest earnings and distribution as part of a still constructive long term story rather than a pure yield play.
AllianceBernstein Holding is extending its push into higher growth client segments such as Asia, U.S. high net worth and global insurance, and the current record level of firm wide assets under management above $905b together with recent inflows from Institutional and Private Wealth channels point to this broader reach continuing to influence management fee revenue.
See why 11 investors see AllianceBernstein Holding as 5% undervalued.
Result: Fair Value of $36.71 (UNDERVALUED)
Still, the AllianceBernstein Holding story can change quickly if equity outflows stay elevated, or if the expected Corebridge insurance assets arrive more slowly than planned.
Find out about the key risks to this AllianceBernstein Holding narrative.
Another View On AllianceBernstein Holding’s Valuation
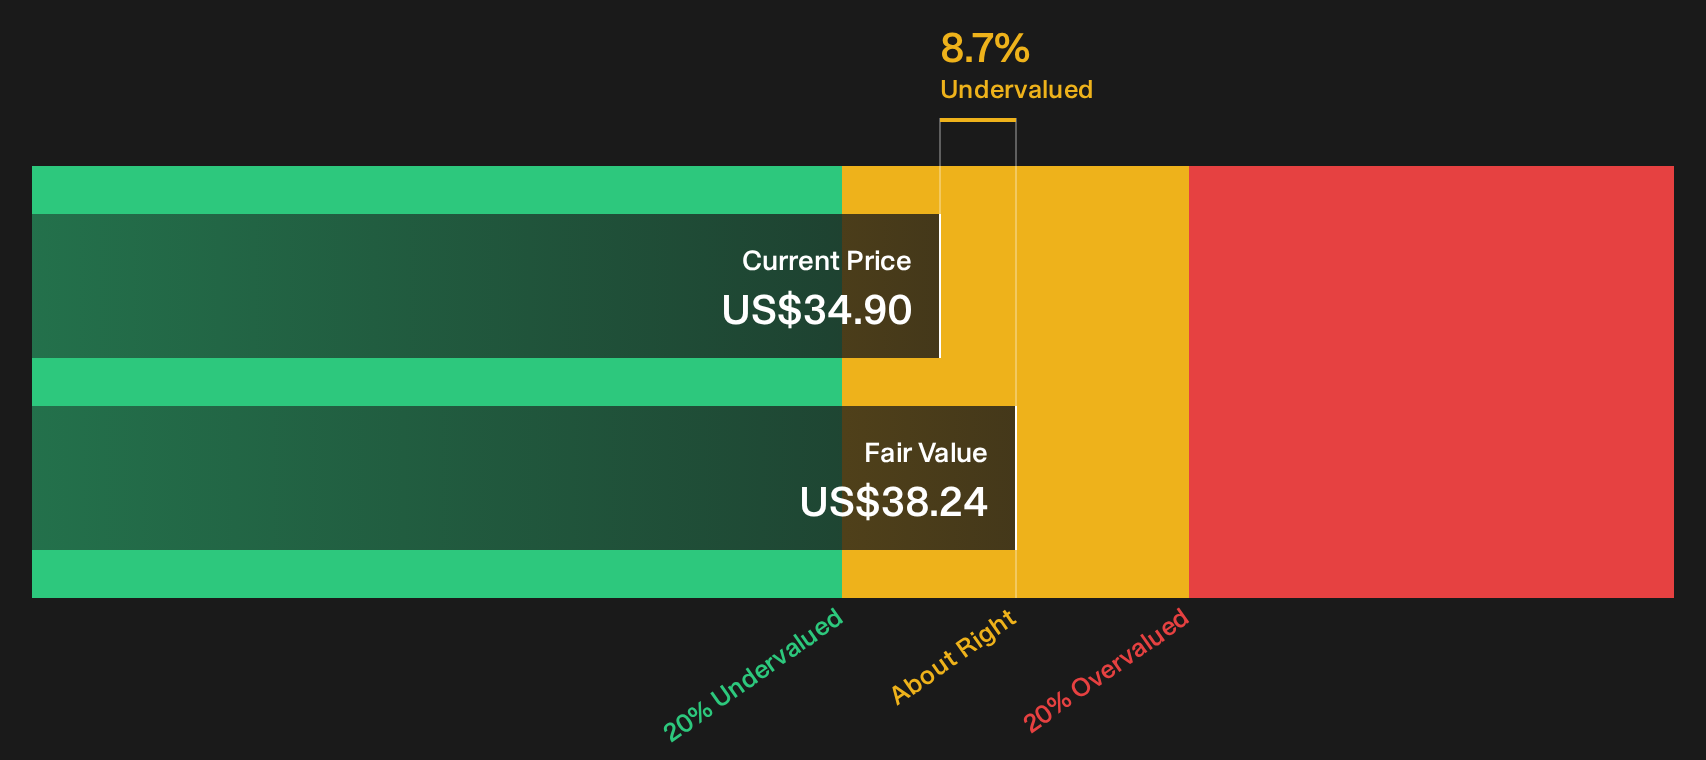
On cash flow maths, the story looks different. The SWS DCF model puts AllianceBernstein Holding’s value around $38.24 per unit, about 8.7% above the recent $34.90 price, while its current P/E of 10.3x sits well above a fair ratio of 6.9x. Which signal do you trust more: cash flows or earnings multiples?
To see how that cash flow view is built line by line, Look into how the SWS DCF model arrives at its fair value..
Next Steps
Mixed messages on AllianceBernstein Holding’s value and income profile can pull you in different directions, so act while the data is fresh and decide where you stand using the 2 key rewards and 3 important warning signs.
Looking for more investment ideas beyond AllianceBernstein Holding?
If AllianceBernstein Holding has your attention, do not stop there. Use fresh data screens to surface other opportunities that fit your own risk and income preferences.
- Target resilient balance sheets and steady fundamentals with a focused list of solid balance sheet and fundamentals (25 results) so you are not relying on hope when markets turn.
- Hunt for potential mispricings using the 42 high quality undervalued stocks and compare those candidates directly against AllianceBernstein Holding on valuation and quality.
- Stack your portfolio with income ideas by lining up high yielders in the 6 dividend fortresses and see which ones match your payout and risk expectations.
Have feedback on this article? Concerned about the content? Get in touch with us directly. Alternatively, email editorial-team@simplywallst.com