


Liberty Latin America has delivered a mixed ride for shareholders, with the stock up over shorter periods but showing a sizeable decline over 5 years, which puts fresh attention on whether today's valuation is properly anchored in its sales base. For anyone looking at the telecom operator now, the key issue is how much revenue the current share price is really asking you to pay for.
- The stock has fallen 34.7% over the past 5 years, so the market's long run verdict puts extra weight on whether current sales can support a sustained recovery story.
- The business depends heavily on converting its subscription driven revenue into stable cash flow, which can support investment needs and shape how much investors are willing to pay for each dollar of sales.
- The analysts covering Liberty Latin America have run their own numbers. See what analysts think Liberty Latin America's shares could be worth.
The issue now is whether Liberty Latin America's current share price is justified by the scale and resilience of its sales.
If you are evaluating Liberty Latin America using its sales multiple, it can be helpful to compare it with other companies screened for 42 high quality undervalued stocks.
Is Liberty Latin America a Bargain on Sales?
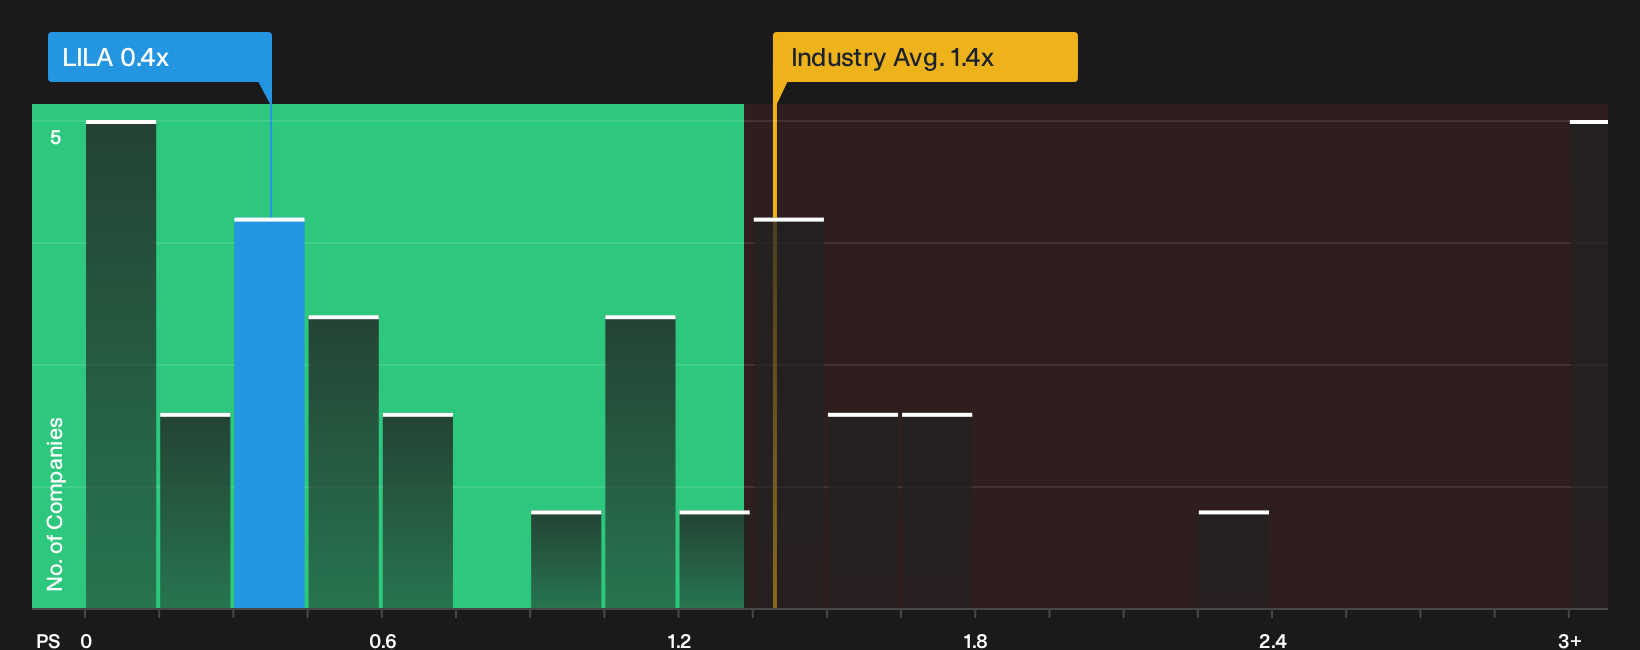
P/S works well for Liberty Latin America because investors often value telecom operators on how much they pay for each dollar of revenue. On that score, the stock trades on a P/S of 0.4x, which is far below the telecom industry average of about 1.4x and also lower than the peer group level of roughly 2.2x. That points to the market assigning a relatively low price tag to the company’s current sales base compared with many comparable operators.
The Fair Ratio model, which adjusts the usual revenue multiple for Liberty Latin America’s specific mix of growth profile, margins, size and risks, sits higher than the current 0.4x reading. As a result, the shares change hands at a discount to what that tailored benchmark implies. The gap raises questions about whether investors are pricing in extra business or balance sheet risk. For anyone weighing this stock, the key issue is whether the quality and durability of those revenues match what the Fair Ratio suggests they might be worth. Explore the numbers behind Liberty Latin America's P/S valuation.
The Liberty Latin America Narrative: What Would Justify Today's Price?
Narratives on Liberty Latin America pick up where the P/S puzzle leaves off by explaining what kind of future path for growth, profitability and earnings would need to occur for the stock to be worth meaningfully more or less than today’s valuation. Instead of a single ratio or model output, they describe the business conditions that number relies on so you can watch how closely reality tracks those assumptions on Simply Wall St’s Community page.
Bulls and bears on Liberty Latin America are looking at the same cash flow story and drawing very different conclusions.
Bull case: 36% undervalued
"Evidence of material cost out traction in Liberty Costa Rica, where adjusted OIBDA margin reached 38% despite flat revenue and pressure on fixed ARPU…"
Discover why this Narrative puts Liberty Latin America at 36% undervalued.
Bear case: 27% overvalued
"Portfolio moves such as the sale of the Peruvian fixed broadband business and issuance of 9.0% preference shares, combined with ring fenced financing at Liberty Puerto Rico, could leave the remaining footprint more concentrated in slower growth or higher risk markets…"
Explore why this Narrative puts Liberty Latin America at 27% overvalued.
One more Liberty Latin America check that belongs beside the price tag
Before you stop at the multiples, it helps to see who is actually steering Liberty Latin America and how their pay packets line up with your interests. See who runs Liberty Latin America and how they are paid.
Have feedback on this article? Concerned about the content? Get in touch with us directly. Alternatively, email editorial-team@simplywallst.com