


- ReNew Energy Global reported Q2 FY27 results for the quarter and six months ended September 30, 2026, with revenue of ₹49,619m and quarterly net income of ₹6,422m, alongside higher basic and diluted earnings per share from continuing operations compared with the prior year period.
- The business paired this profitability picture with higher full year FY27 adjusted EBITDA guidance. Management currently views the expanded 13.8 GW operating portfolio and capital recycling progress as supporting stronger operating performance than previously expected.
- ReNew Energy Global's raised full year EBITDA guidance may influence how investors view the investment narrative built around its integrated renewables platform.
Scan beyond ReNew Energy Global's latest earnings beat and see how other renewable-focused operators stack up in our hand picked screener of 40 power grid technology and infrastructure stocks.
ReNew Energy Global Investment Narrative Recap
To own ReNew Energy Global, you need to be on board with a simple idea. The business is trying to turn a large operating portfolio, integrated manufacturing and capital recycling into steadier earnings from long term contracts. The raised FY27 adjusted EBITDA guidance and 13.8 GW operating base support that narrative, but they do not remove execution risk.
The near term swing factor is whether new projects and manufacturing capacity ramp smoothly without heavy margin pressure or grid related curtailment. Competitive bidding, weaker manufacturing profitability and interest coverage remain key watchpoints. The latest earnings beat helps investor confidence, although it does not materially change these core risks.
The most relevant fresh data point here is the Q2 FY27 earnings release on 2 November 2026. ReNew Energy Global reported Q2 revenue of ₹49,619m and net income of ₹6,422m. Both basic and diluted EPS from continuing operations were higher than a year earlier. For the first half, revenue reached ₹97,483m and net income was ₹12,375m.
This print matters for your catalyst checklist. Adjusted EBITDA climbed 28% year on year and profit after tax rose 37.3%. Management lifted FY27 adjusted EBITDA guidance to ₹105b to ₹109b. That upgrade, backed by a 13.8 GW operating portfolio and active capital recycling, speaks directly to the near term earnings delivery investors are watching most closely.
ReNew Energy Global Forecasts and Analyst Assumptions
Analysts are effectively sketching a medium term roadmap for ReNew Energy Global that hinges on steady top line expansion and only modest pressure on profitability. Their models point to revenue growth of 19.2% per year over the next three years, paired with a small dip in profit margin from 7.9% today to 7.6% by around 2029.
On the earnings line, the current analyst set has ReNew Energy Global moving from earnings today of ₹10.9b to a consensus forecast of ₹17.7b by 2029. That shift implies an earnings increase of about ₹6.8b over the period, which is what needs to show up in the income statement for the broader narrative around scale, integration and capital recycling to keep holding together.
Those same forecasts sit on specific capital market assumptions. The analyst group is effectively underwriting a P/E multiple of 22.6x on 2029 earnings, compared with a current P/E of 22.3x for the stock and 26.7x for the wider US renewable energy peer set. That gap matters if you are comparing what you pay today with what analysts think is already embedded in the share price path out to 2029.
Consensus views on share count growth and funding also shape the picture. Forecasters are building in 0.32% annual growth in shares outstanding over the next three years and using a discount rate of about 13.6% to pull future cash flows and earnings back into today’s valuation frame. If your own required return is higher or lower than that, the implied value range for ReNew Energy Global can swing meaningfully.
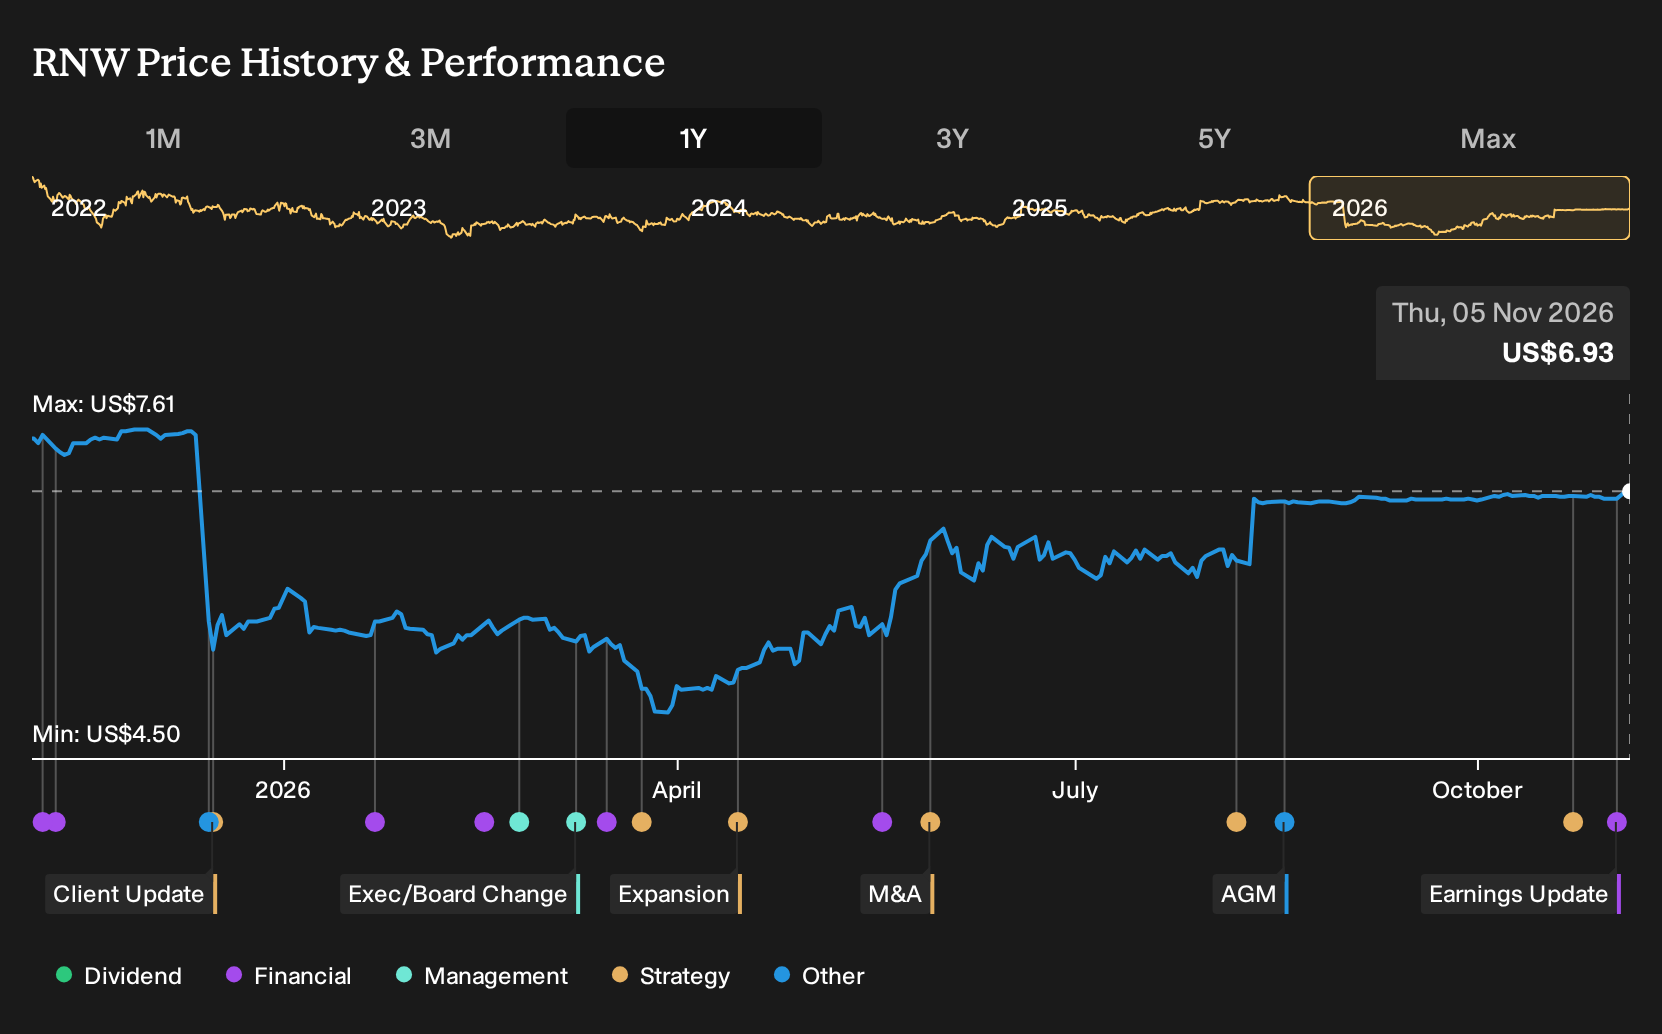
On the price target side, the market has a reference range rather than a single fixed point. Analysts currently cluster around a consensus target of US$7.66, with the most optimistic at US$8.61 and the most cautious at US$6.98, against a recent share price of US$6.88. That spread reflects different views on how quickly the business can translate its 13.8 GW operating base and manufacturing build out into the ₹17.7b earnings outcome by 2029.
ReNew Energy Global's narrative projects ₹233.1b revenue and ₹17.7b earnings by 2029. This setup assumes 19.2% yearly revenue growth and an earnings increase of about ₹6.8b from earnings today of ₹10.9b.
Uncover why ReNew Energy Global's fair value indicates a 10% potential upside to its current price, which could close quicker than many investors expect.
Exploring Other Perspectives
One alternate angle on ReNew Energy Global focuses on how far earnings might stretch if the manufacturing and storage shift plays out cleanly. The most optimistic analysts were sketching about ₹256.9b of revenue and roughly ₹33.0b of earnings by 2029, well above consensus. Those estimates came before this Q2 release, so opinions may evolve as you compare different scenarios.
Explore 3 other ReNew Energy Global fair value estimates, including one that suggests as much as 24% upside from the current price.
Form Your Own Verdict
Don't just follow the ticker, dig into the data and build a conviction that's truly your own.
- A great starting point for your ReNew Energy Global research is our analysis highlighting 3 key rewards and 2 important warning signs that could impact your investment decision.
- See our latest analysis for ReNew Energy Global. The report includes a comprehensive fundamental analysis summarized in a single visual, the Snowflake, making it easy to evaluate ReNew Energy Global's overall financial health at a glance.
Looking for more investment ideas beyond ReNew Energy Global?
Once you have a view on ReNew Energy Global, it can help to compare it with other opportunities that share some of the same strengths you care about. The Simply Wall St Screener lets you filter for exactly the mix of balance sheet quality, income potential, or valuation profile that fits your plan.
- If resilience is your priority, start with a group of companies that score well on stability by reviewing 32 resilient stocks with low risk scores and see which ones warrant a place on your watchlist.
- If you want income on top of potential capital gains, scan a curated set of high-yielding payers through 6 dividend fortresses and check which distributions align with your risk tolerance.
- If you are hunting for less crowded opportunities with solid metrics, focus on under-the-radar candidates using 21 high quality undiscovered gems and compare their fundamentals side by side.
Have feedback on this article? Concerned about the content? Get in touch with us directly. Alternatively, email editorial-team@simplywallst.com