


CBL & Associates Properties (CBL) just paired an earnings update with a fresh stock buyback, reporting higher adjusted funds from operations guidance along with authorization for up to US$25 million in share repurchases through 2027.
Recent trading tells a mixed story for CBL & Associates Properties. The share price has slipped over the past week and quarter, with the 7 day move down 6.13% and the 90 day share price return down 16.32%. However, the year to date share price return of 28.13% and 1 year total shareholder return of 52.29% point to strong earlier momentum. Recent earnings and the buyback plan are now testing that momentum as investors reassess both growth prospects and risk.
Scan CBL & Associates Properties alongside a handpicked 39 high quality undervalued stocks that may combine stronger fundamentals with potential mispricing in the market.
So is CBL & Associates Properties selling off because the business just hit a ceiling, or because sentiment is cooling after a strong run into the buyback and guidance raise? It is time to test that through valuation.
Price-to-Earnings of 9.7x: Is it justified?
Valuation for CBL & Associates Properties hinges on what investors are willing to pay for its profitability, and the current P/E of 9.7x sits well below both the wider US market and Retail REIT peers while the share price closed at $47.32.
The P/E ratio compares the stock price to earnings per share and gives a quick sense of how much you are paying for each dollar of profit. For a real estate investment trust like CBL & Associates Properties, that lens can help you judge whether the market is putting a premium or a discount on its earnings profile.
CBL & Associates Properties trades on a P/E of 9.7x, which is below the US market average of 17.6x. It also screens as good value against Retail REIT peers at 35.8x, which signals that investors are paying far less for each dollar of CBL earnings than for the sector overall. Against that comparison, the estimated fair P/E of 9.2x suggests the current multiple sits modestly above where the SWS fair ratio model indicates the market could settle if sentiment and fundamentals were closely aligned.
Relative to the US Retail REITs industry average of 25.2x, the current 9.7x earnings multiple appears materially cheaper. This supports the view that the stock trades at a steep discount to sector pricing, even if it is a little above the fair ratio mark.
Explore the SWS fair ratio for CBL & Associates Properties.
Result: Price-to-Earnings of 9.7x (UNDERVALUED)
Still, the sharp decline in net income growth and the recent share price weakness over 30 and 90 days show how quickly sentiment on CBL & Associates Properties can cool.
Find out about the key risks to this CBL & Associates Properties narrative.
Another View: What The SWS DCF Model Says About CBL & Associates Properties
The low 9.7x P/E paints CBL & Associates Properties as cheap against Retail REITs, yet the SWS DCF model comes to a different answer. Using forecast cash flows, it points to a value of $44.16 per share, which leaves the recent $47.32 price looking slightly overvalued instead of discounted.
Cash flow based models can react very differently to one off gains and shifting growth expectations compared with simple earnings multiples. The question is which lens you trust more when those signals do not line up.
Look into how the SWS DCF model arrives at its fair value.
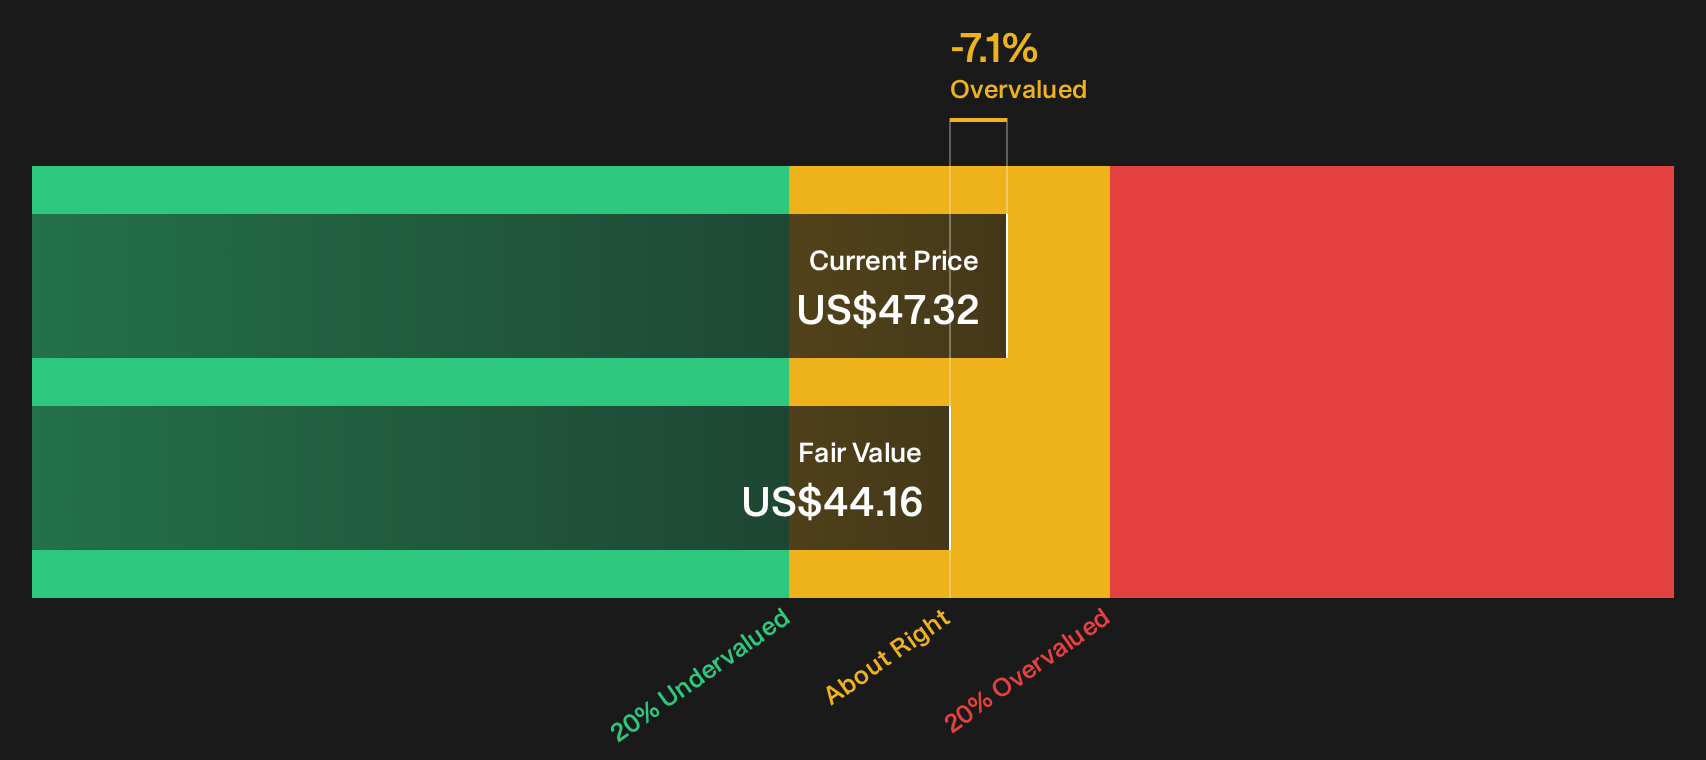
Simply Wall St performs a discounted cash flow (DCF) on every stock in the world every day (check out CBL & Associates Properties for example). We show the entire calculation in full. You can track the result in your watchlist or portfolio and be alerted when this changes, or use our stock screener to discover 39 high quality undervalued stocks. If you save a screener we even alert you when new companies match - so you never miss a potential opportunity.
Next Steps
Mixed signals around CBL & Associates Properties can pull you in both directions. Move quickly, review the data, and weigh the 2 key rewards and 4 important warning signs against your own expectations.
Looking for more investment ideas beyond CBL & Associates Properties?
If CBL & Associates Properties has you rethinking valuation and risk, use that momentum to scan a wider watchlist and pressure test your next move.
- Target steadier compounding by reviewing a curated 29 resilient stocks with low risk scores that focuses on businesses with more resilient profiles when markets turn choppy.
- Hunt for potential mispricings by working through a focused 19 high quality undiscovered gems that highlights quality fundamentals the market may not be paying full attention to yet.
- Strengthen your downside protection by scanning a list of solid balance sheet and fundamentals (24 results) that filters for stronger finances before sentiment swings again.
Have feedback on this article? Concerned about the content? Get in touch with us directly. Alternatively, email editorial-team@simplywallst.com