


Central Bancompany (CBC) just tied its latest shareholder return decision to improving financial results, with directors approving a higher regular quarterly cash dividend alongside third quarter earnings and buyback activity that keep capital deployment in focus.
Central Bancompany’s latest dividend hike lands after a sharp upswing in the share price, with a 30 day share price return of 18.49% contributing to a 58.28% year to date gain and a 3 year total shareholder return of 202.17%. Momentum has been building as investors react to stronger reported earnings, ongoing buybacks and a richer income stream.
Scan how Central Bancompany’s dividend move and earnings momentum compare with other banks by reviewing our curated 29 resilient stocks with low risk scores in the sector.
Central Bancompany’s combination of a higher dividend, active buybacks and a rapid rerating on the chart presents a clear choice. You can either pay up for momentum now or wait and hope valuation gives you another opportunity.
Price-to-Earnings of 20.2x: Is it justified?
Central Bancompany is trading on a P/E of 20.2x, a rich tag against other US banks, which is hard to ignore at a last close of $37.75.
The P/E ratio compares what investors pay for each dollar of current earnings. For a lender like Central Bancompany, that yardstick often reflects how confident the market is in the durability of profits and the stability of the balance sheet, rather than just next quarter’s results.
CBC has seen earnings grow 30% over the past year and 12.4% per year over the past 5 years, and profits are forecast to rise 5.7% per year. That earnings profile can help explain why the market is willing to pay more today, although the fair P/E implied by the SWS model is 12.1x. This is a level the valuation suggests the share price could gravitate toward over time.
Compared with the US Banks industry average P/E of 11.3x and a peer average of 10.3x, Central Bancompany’s 20.2x multiple is far higher. This indicates investors are assigning a premium well above sector norms rather than treating it as just another regional bank.
Explore the SWS fair ratio for Central Bancompany.
Result: Price-to-Earnings of 20.2x (OVERVALUED)
Still, any stumble in Central Bancompany’s earnings trajectory, or a shift in sentiment toward higher priced regional banks, could quickly challenge this premium story.
Find out about the key risks to this Central Bancompany narrative.
Another View: What The SWS DCF Model Says
The earlier P/E workup paints Central Bancompany as expensive, yet the SWS DCF model points in the opposite direction. In that framework, CBC at $37.75 trades about 13.4% below an estimated future cash flow value of $43.58, which makes the current premium multiple less clear cut. Which signal do you treat as more important?
Look into how the SWS DCF model arrives at its fair value.
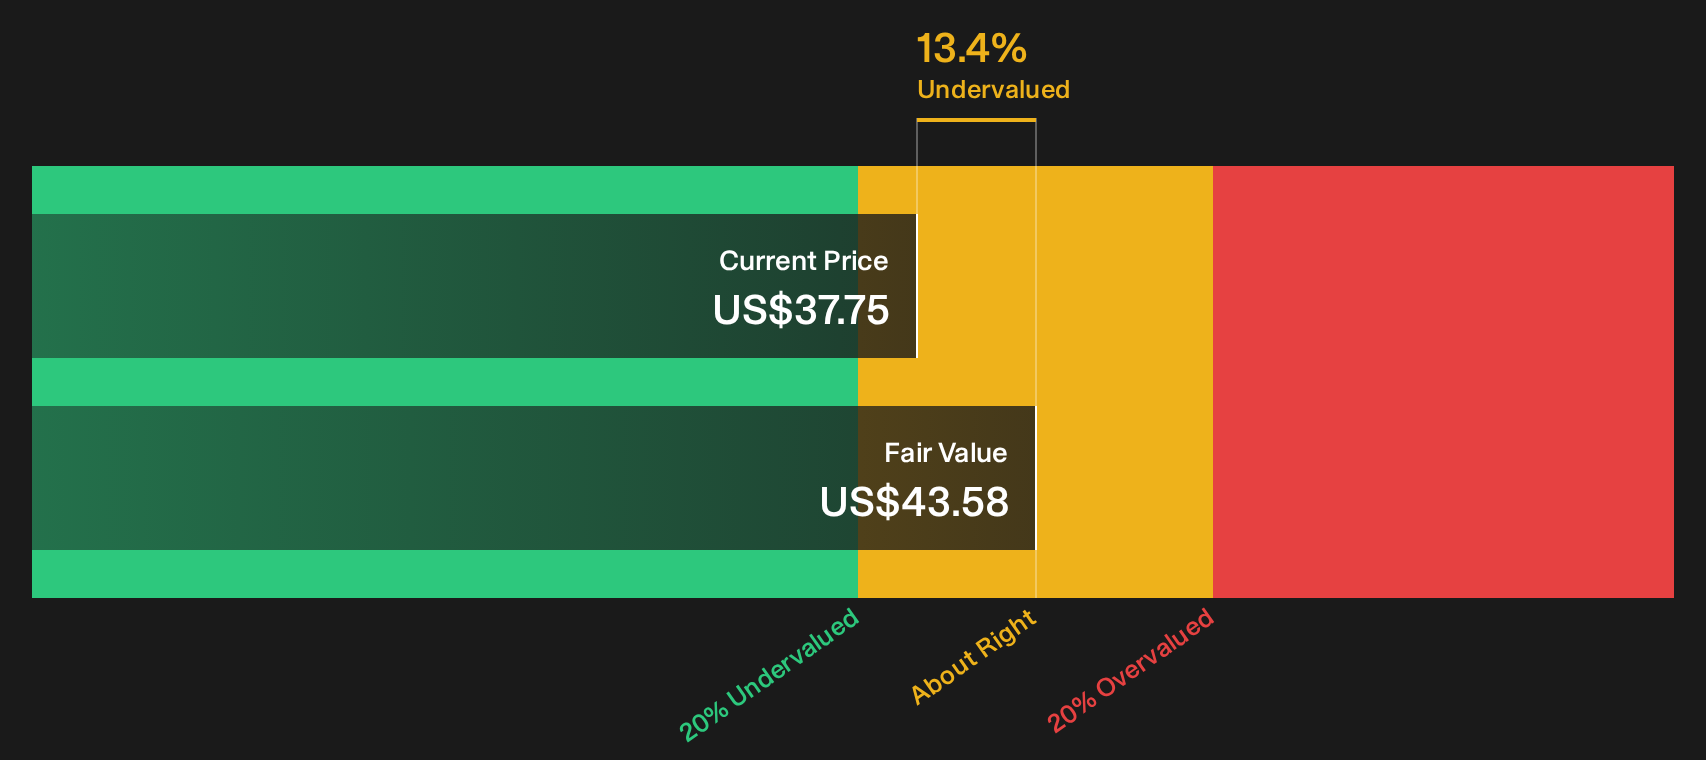
Simply Wall St performs a discounted cash flow (DCF) on every stock in the world every day (check out Central Bancompany for example). We show the entire calculation in full. You can track the result in your watchlist or portfolio and be alerted when this changes, or use our stock screener to discover 39 high quality undervalued stocks. If you save a screener we even alert you when new companies match - so you never miss a potential opportunity.
Next Steps
Sentiment around Central Bancompany is clearly split, with valuation signals pulling in different directions, so move quickly to review the numbers yourself and decide what matters most. To see which potential bright spots investors are focused on, check out the 3 key rewards.
Looking for more investment ideas beyond Central Bancompany?
If Central Bancompany has your attention, do not stop there. Broaden your watchlist with high quality ideas that line up with your own risk and income goals.
- Target resilience by reviewing the list of solid balance sheet and fundamentals (24 results) and focus on businesses with sturdier finances backing their share price.
- Hunt for value by scanning the 39 high quality undervalued stocks that surface companies with quality fundamentals trading at more modest valuations.
- Strengthen your income stream by assessing the 8 dividend fortresses that highlight higher yielding payouts supported by underlying cash flows.
Have feedback on this article? Concerned about the content? Get in touch with us directly. Alternatively, email editorial-team@simplywallst.com