


Introduction: Finding Good Trades Is Only Half the Challenge
Seasonal commodity spread trading is built around the observation that certain price relationships tend to follow recurring patterns throughout the year. These patterns can create attractive opportunities without requiring traders to predict the outright direction of commodity prices. My Smart Spreads strategy has traditionally focused on identifying trades with favorable historical characteristics, including profitability, win rates, drawdowns, entry timing, and contract structure. But recently, I began asking a different question:
- Rather than simply identifying attractive seasonal trades, could I determine which opportunities deserve the highest priority across an entire year?
That distinction is important. A trade may have an attractive historical record but still represent a less desirable use of capital than another opportunity approaching just a few weeks later. To address this challenge, I developed a process that evaluates historical commodity spread performance across the calendar year, ranks the opportunities, and organizes them into an annual timeline. The objective is straightforward:
- Identify the best historical opportunities before committing capital to lower-priority trades.
Sugar provides an excellent example of how this process works.
What the Sugar Research Revealed
My historical analysis identified several attractive seasonal opportunities in Sugar #11 and White Sugar. Rather than evaluating each trade independently, I compared their historical performance and ranked them using a common scoring framework. The Historical Opportunity Score evaluates four characteristics:
- Win rate (30%): The historical consistency of profitable outcomes.
- Average profit (25%): The average financial result of the trade.
- Profit relative to drawdown (30%): The relationship between historical profitability and adverse price movement.
- Historical observations (15%): The number of records supporting the results.
Each opportunity receives a score on a 100-point scale. The resulting Sugar rankings produced several interesting observations.
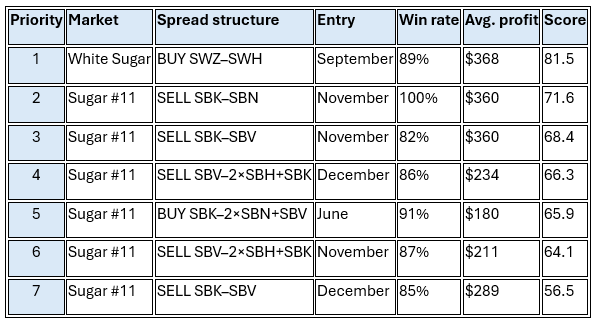
Historical rankings based on the research dataset. Results are averages of historical observations and do not represent guaranteed future performance.
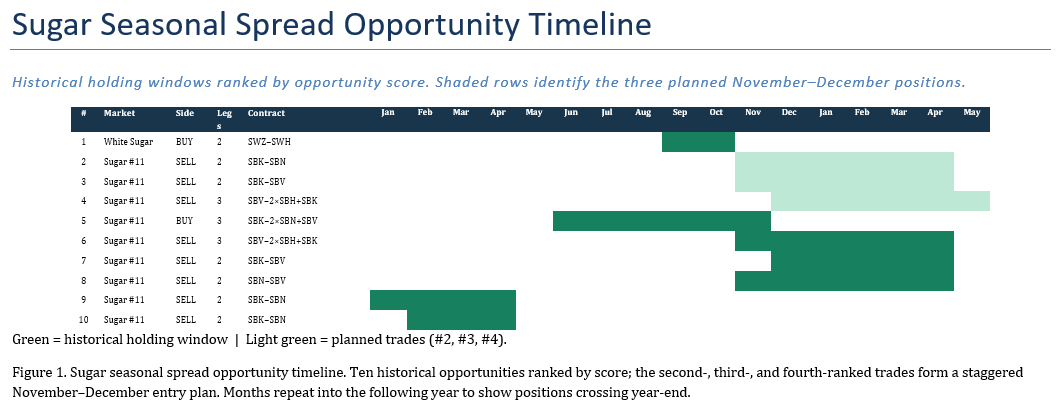
The highest-ranked opportunity is a White Sugar spread beginning in September. Its historical performance is particularly attractive because of its favorable profit-to-drawdown ratio. However, that opportunity has already passed for the current seasonal cycle. This is where the annual timeline becomes particularly useful.
Turning Historical Rankings Into a Trading Plan
Looking at the remaining opportunities, three Sugar #11 spreads stand out.
- The first is a short May–October calendar spread (SBK–SBV), ranked third overall. This trade has historically generated an average profit of $360, with an 82% win rate across 39 observations.
- The second is a short May–July calendar spread (SBK–SBN), ranked second overall. It has produced an average historical profit of $360 and a 100% win rate across 19 observations.
- The third is a short three-leg butterfly (SBV–2×SBH+SBK), ranked fourth overall. It has generated an average profit of $234, with an 86% win rate across 66 observations.
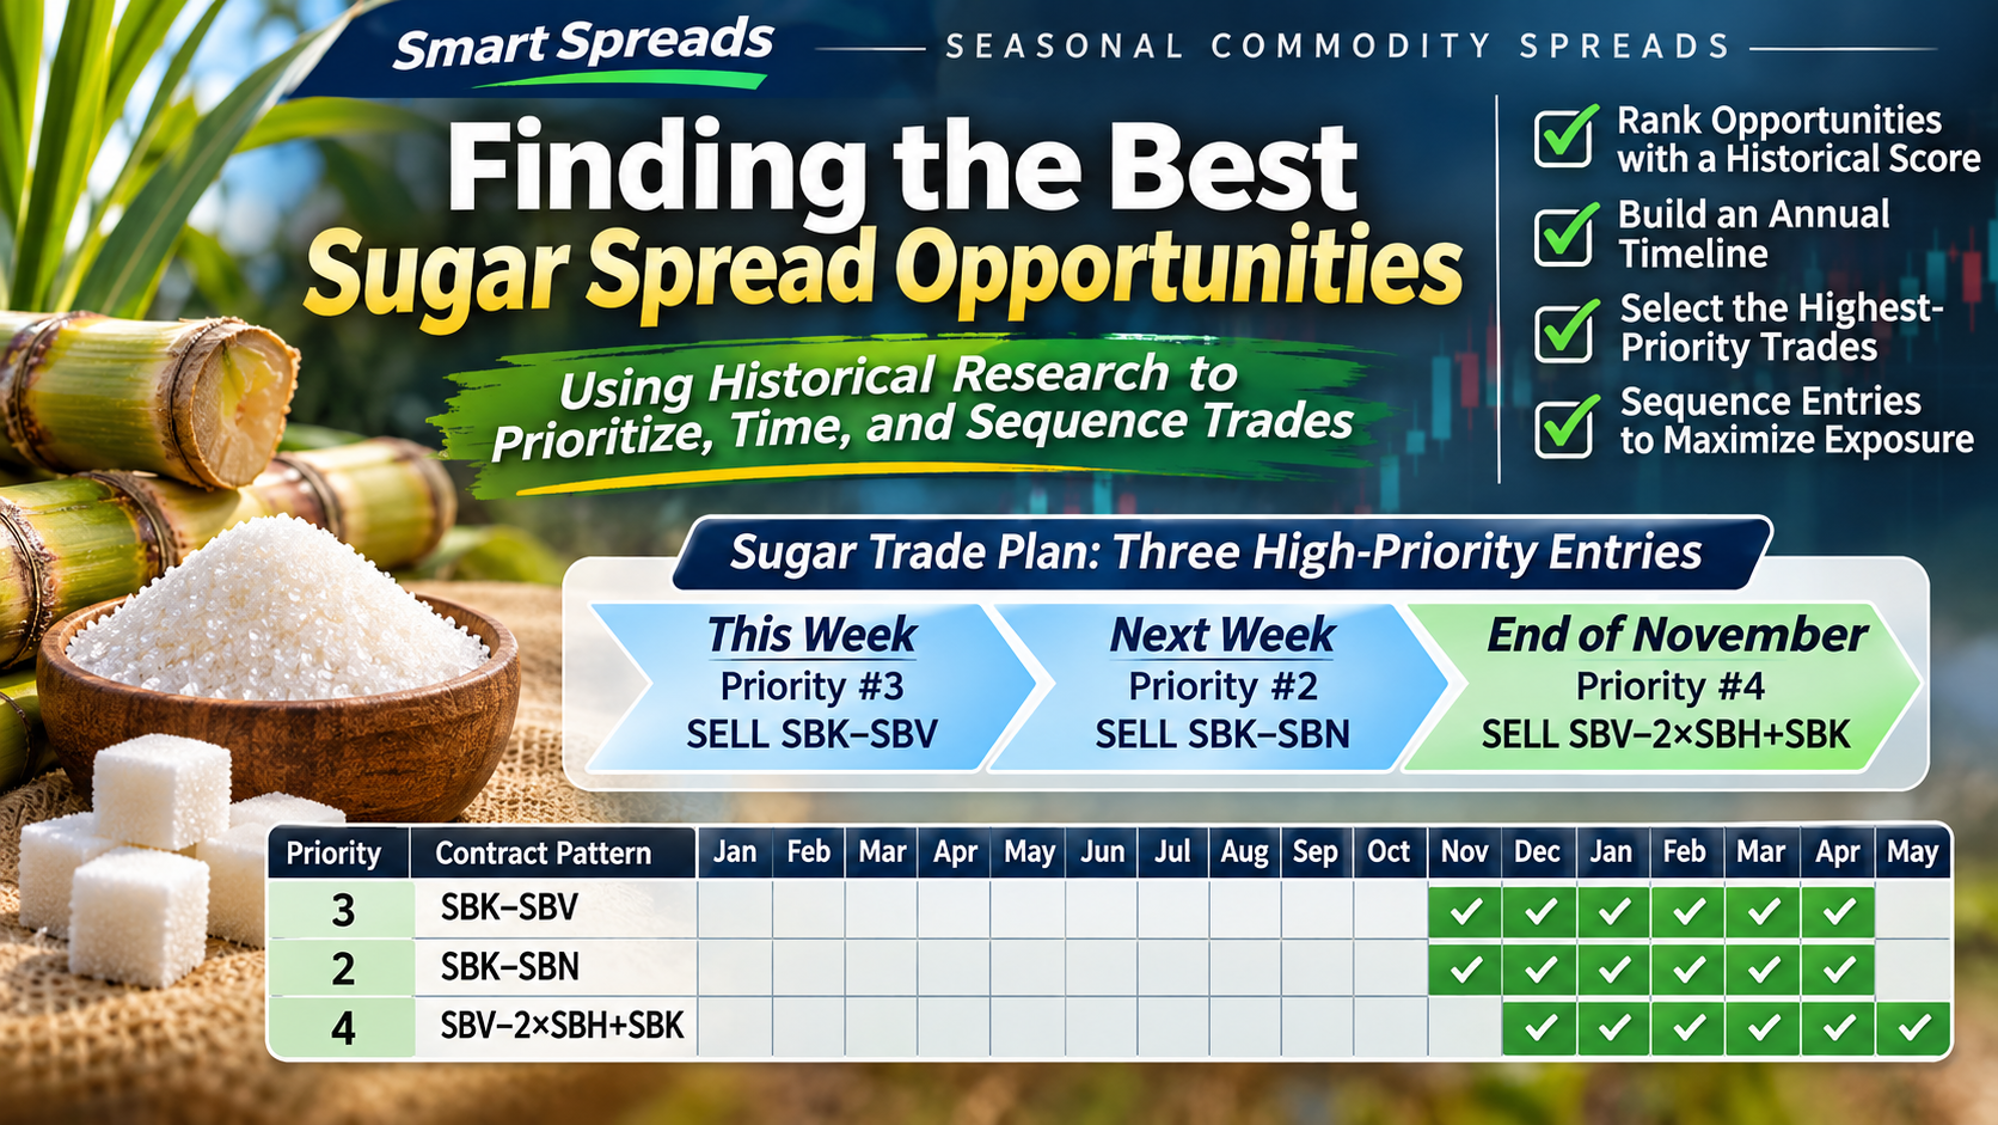
Rather than choosing only one of these trades, the timeline suggests an opportunity to build Sugar exposure gradually. My current plan is to enter the third-ranked spread this week, add the second-ranked spread next week, and establish the fourth-ranked spread near the beginning of December. This creates a sequence of entries across several weeks, using different contract structures while concentrating on some of the strongest historical opportunities identified by the research. The approach offers several potential advantages.
- First, it spreads entry timing across multiple weeks. Rather than committing all capital at one price level, it establishes positions at different points in the seasonal window.
- Second, it combines different contract structures. Although all three positions involve Sugar, the contract relationships differ, which may create different performance characteristics.
- Third, it prioritizes historically stronger opportunities. Instead of entering every trade that meets minimum screening requirements, capital goes to opportunities with higher historical scores.
The objective is not simply to maintain exposure to Sugar. It is to establish that exposure through a deliberate sequence of historically attractive trades. Of course, these positions remain exposed to common Sugar market fundamentals. Staggered entries and using different contract structures do not eliminate correlated risk, and the combined exposure must remain consistent with portfolio risk limits.
Why the Annual Timeline Changes the Decision
The real value of this approach becomes apparent when we look beyond the individual trades. Without an annual timeline, I might identify an attractive Sugar spread in October or November and enter it simply because its historical performance meets my minimum requirements. But that decision could consume capital needed for a stronger opportunity approaching a few weeks later. By reviewing the entire year in advance, I can see when the most attractive historical windows occur, how long they typically last, and where opportunities overlap. This allows me to distinguish between two very different questions:
- Is this a good seasonal trade?
- Is this one of the best seasonal trades available for the capital I am committing?
The second question is becoming increasingly important to my Smart Spreads strategy. In the Sugar example, the annual rankings help identify the stronger opportunities, while the timeline helps determine how to sequence them. The result is a more deliberate approach to trade selection and capital allocation.
Additional Details
Dual Edge Research publishes 2 weekly newsletters offered at one low price:
- The Bull Strangle Newsletter focuses on stocks and options, combining stock ownership with disciplined option-selling techniques designed to generate consistent income while managing risk.
- The Smart Spreads Newsletter focuses on seasonal commodity spreads, a historically proven approach that seeks opportunities across agricultural, energy, metal, and financial futures markets.
Each strategy is designed to stand on its own, but together they provide a diversified approach that can perform across a wide range of market environments. For traders looking to deepen their education, The Bull Strangle Strategy and Trading Commodity Spreads are both available on Amazon.
Visit BullStrangle.com to subscribe for just $1 for the first month.
For a video overview of the Bull Strangle Newsletter
For a video overview of the Smart Spreads Newsletter
Darren Carlat
Dual Edge Research
(214) 636-3133
DualEdgeResearch@gmail.com
Disclaimer
This information is for informational purposes only and should not be considered investment advice. Past performance is not indicative of future results, and all investments carry inherent risk. Consult with a financial advisor before making any investment decisions.