


Live by the Sword’s new Times Square studio, fully powered by Square’s commerce tools, gives Block (XYZ) a high profile case study for how its platform supports experience driven, multi location retail concepts.
Block’s recent headlines arrive during a strong run in the shares, with a 7 day share price return of 12.15% and a year to date gain of 31.20%. The 1 year total shareholder return of 30.60% contrasts with a 5 year total shareholder return that declined 62.39%, signalling that momentum has improved lately after a tough longer stretch.
Scan for other payment and fintech stories on the move by reviewing the hand picked 18 cryptocurrency and blockchain stocks alongside Block’s latest Times Square and earnings momentum.
Block now trades about 13% below the average analyst target and at a steeper intrinsic discount, even after this latest run. Is that genuine caution around DOJ, layoffs and bitcoin volatility, or is it mispricing that valuation work can test next?
Most Popular Narrative: 13% Undervalued
Block’s most followed valuation story pegs fair value at $98.36, above the recent $85.48 close. This frames the current move as a discount rather than euphoria.
The rapid acceleration in new product launches, now supported by an AI native operating model that has lifted code changes per engineer 150% since early 2026 and helped ship 130 Square features in the first half of 2026, points to sustained improvements in Cash App and Square feature velocity that can support higher revenue and operating leverage over time.
See why 196 investors see Block as 13% undervalued.
Result: Fair Value of $98.36 (UNDERVALUED)
Still, the Block narrative can crack if Cash App engagement stalls further or if fraud and regulatory issues push compliance costs higher than bullish models assume.
Find out about the key risks to this Block narrative.
Another View: What Block’s P/E Implies
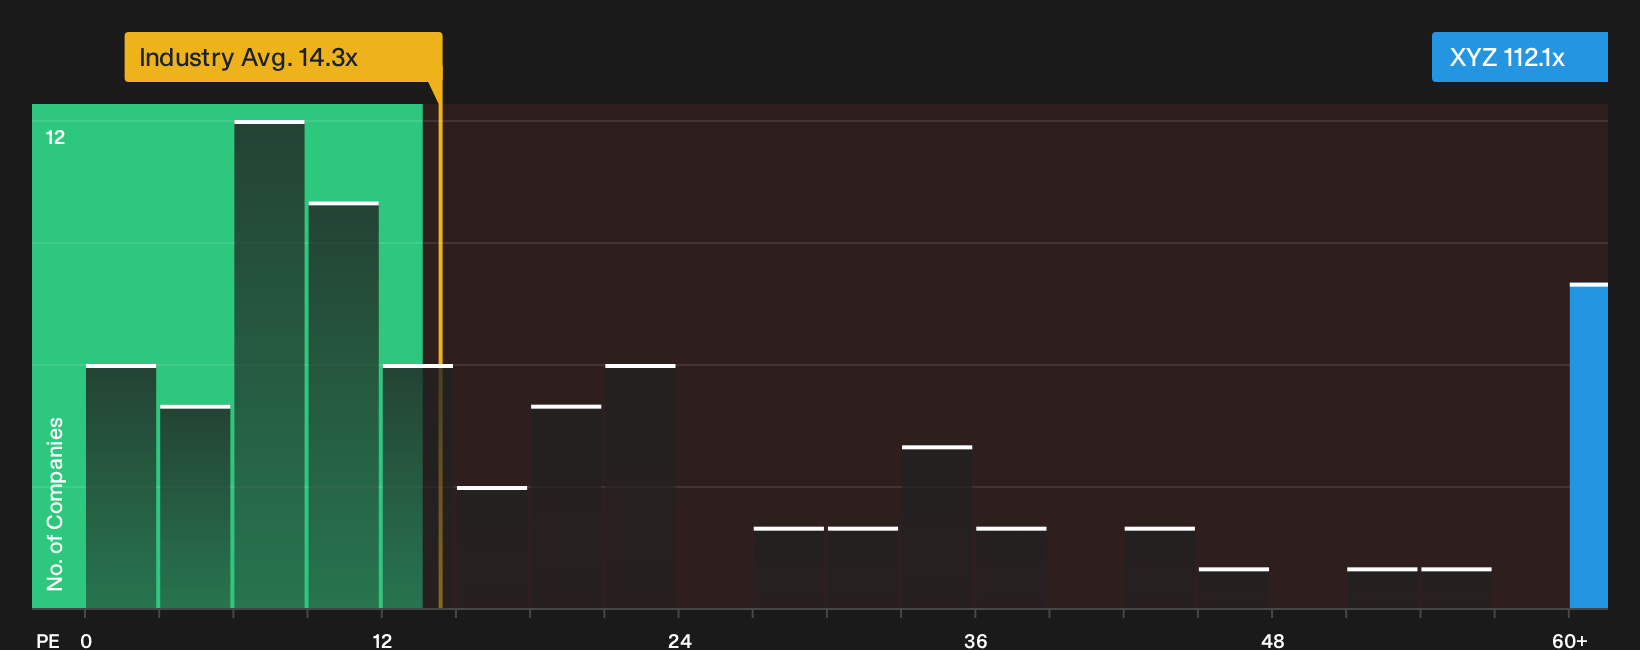
The DCF work paints Block as undervalued, yet the simple earnings multiple tells a different story. The stock trades on a P/E of 112.1x compared with a US Diversified Financial industry average of 14.3x and peers at 57.5x. The fair ratio model points to 31.4x as a level the market could move toward over time. That gap suggests real valuation risk if sentiment cools or earnings slip, so how much weight do you want to give the cash flow model versus what the market is currently paying for profits?
To stress test that high earnings multiple against detailed valuation work, review the See what the numbers say about this price — find out in our valuation breakdown..
For a quick visual check on how Block’s current pricing stacks up against the sector, refer to the
Next Steps
Mixed signals on Block’s story so far. Act quickly, review the data for yourself, then weigh up the 2 key rewards and 2 important warning signs.
Looking for more Block sized investment ideas?
If Block has sharpened your focus on valuation and momentum, you can broaden your opportunity set now with a few targeted screens built to surface distinct edges.
- Target potential mispricing by scanning a curated set of 39 high quality undervalued stocks that combine quality with more attractive entry points.
- Strengthen your income stream by reviewing the 8 dividend fortresses that can support more reliable cash payouts.
- Prioritise resilience by focusing on the 29 resilient stocks with low risk scores that score well on balance sheet strength and business stability.
Have feedback on this article? Concerned about the content? Get in touch with us directly. Alternatively, email editorial-team@simplywallst.com